
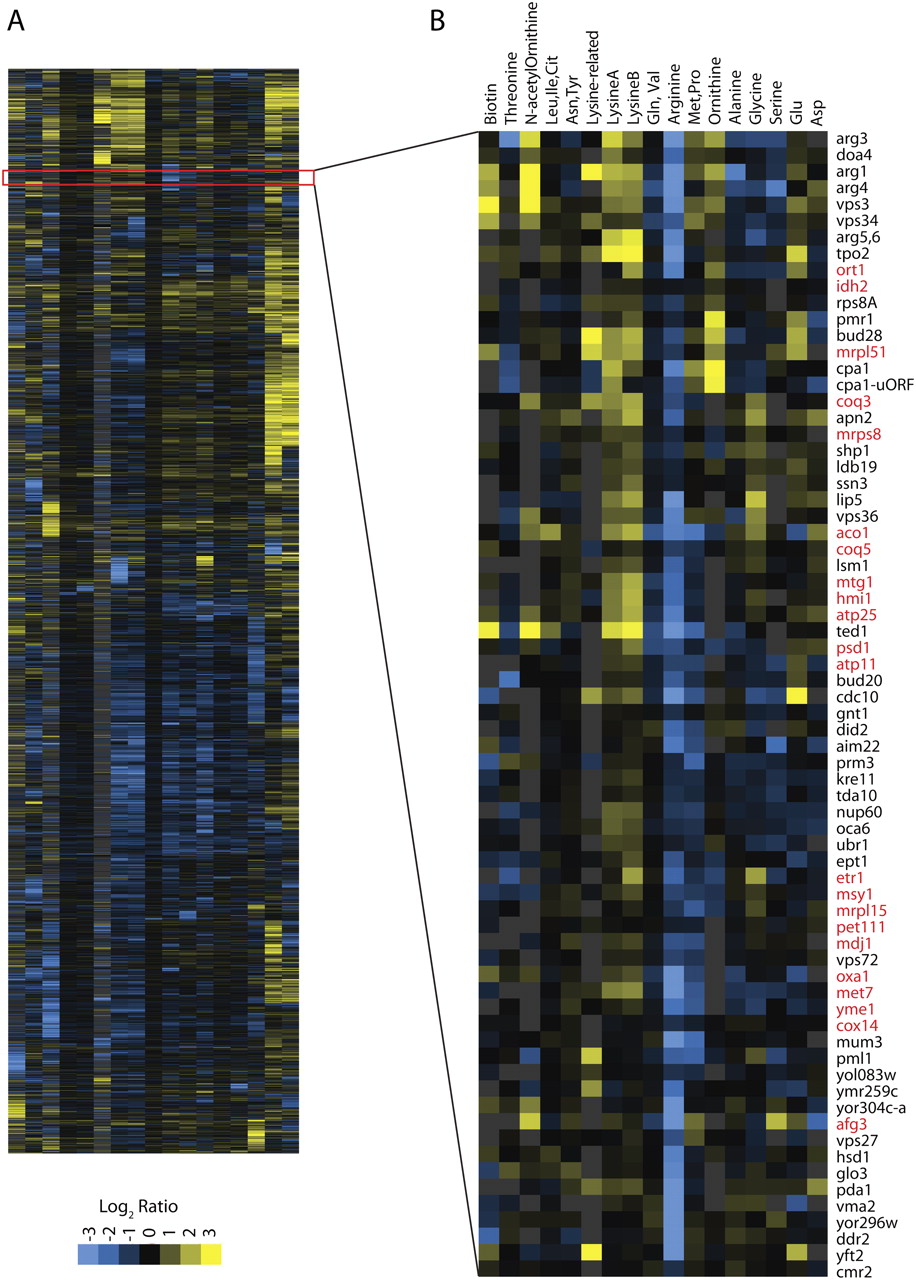
Hierarchical clustering of metabolite profiles. (A) To identify groups of related genes, we ordered 4337 yeast deletion strains using hierarchical clustering as implemented by Cluster software. Columns represent each amino acid as labeled in B. Rows correspond to the profile of a strain lacking a single gene. Yellow represents an increased metabolite level relative to the normalized average; blue represents a decreased level, as indicated in the scale (bottom left). The highlighted region is expanded in panel B. (B) A single cluster of strains showing decreased levels of arginine contains several arginine mutants. This cluster also shows increased lysine and increased citrulline. Along with the arginine mutants, this group with reduced arginine levels is enriched for mutants in mitochondrial protein genes (highlighted in red).


