
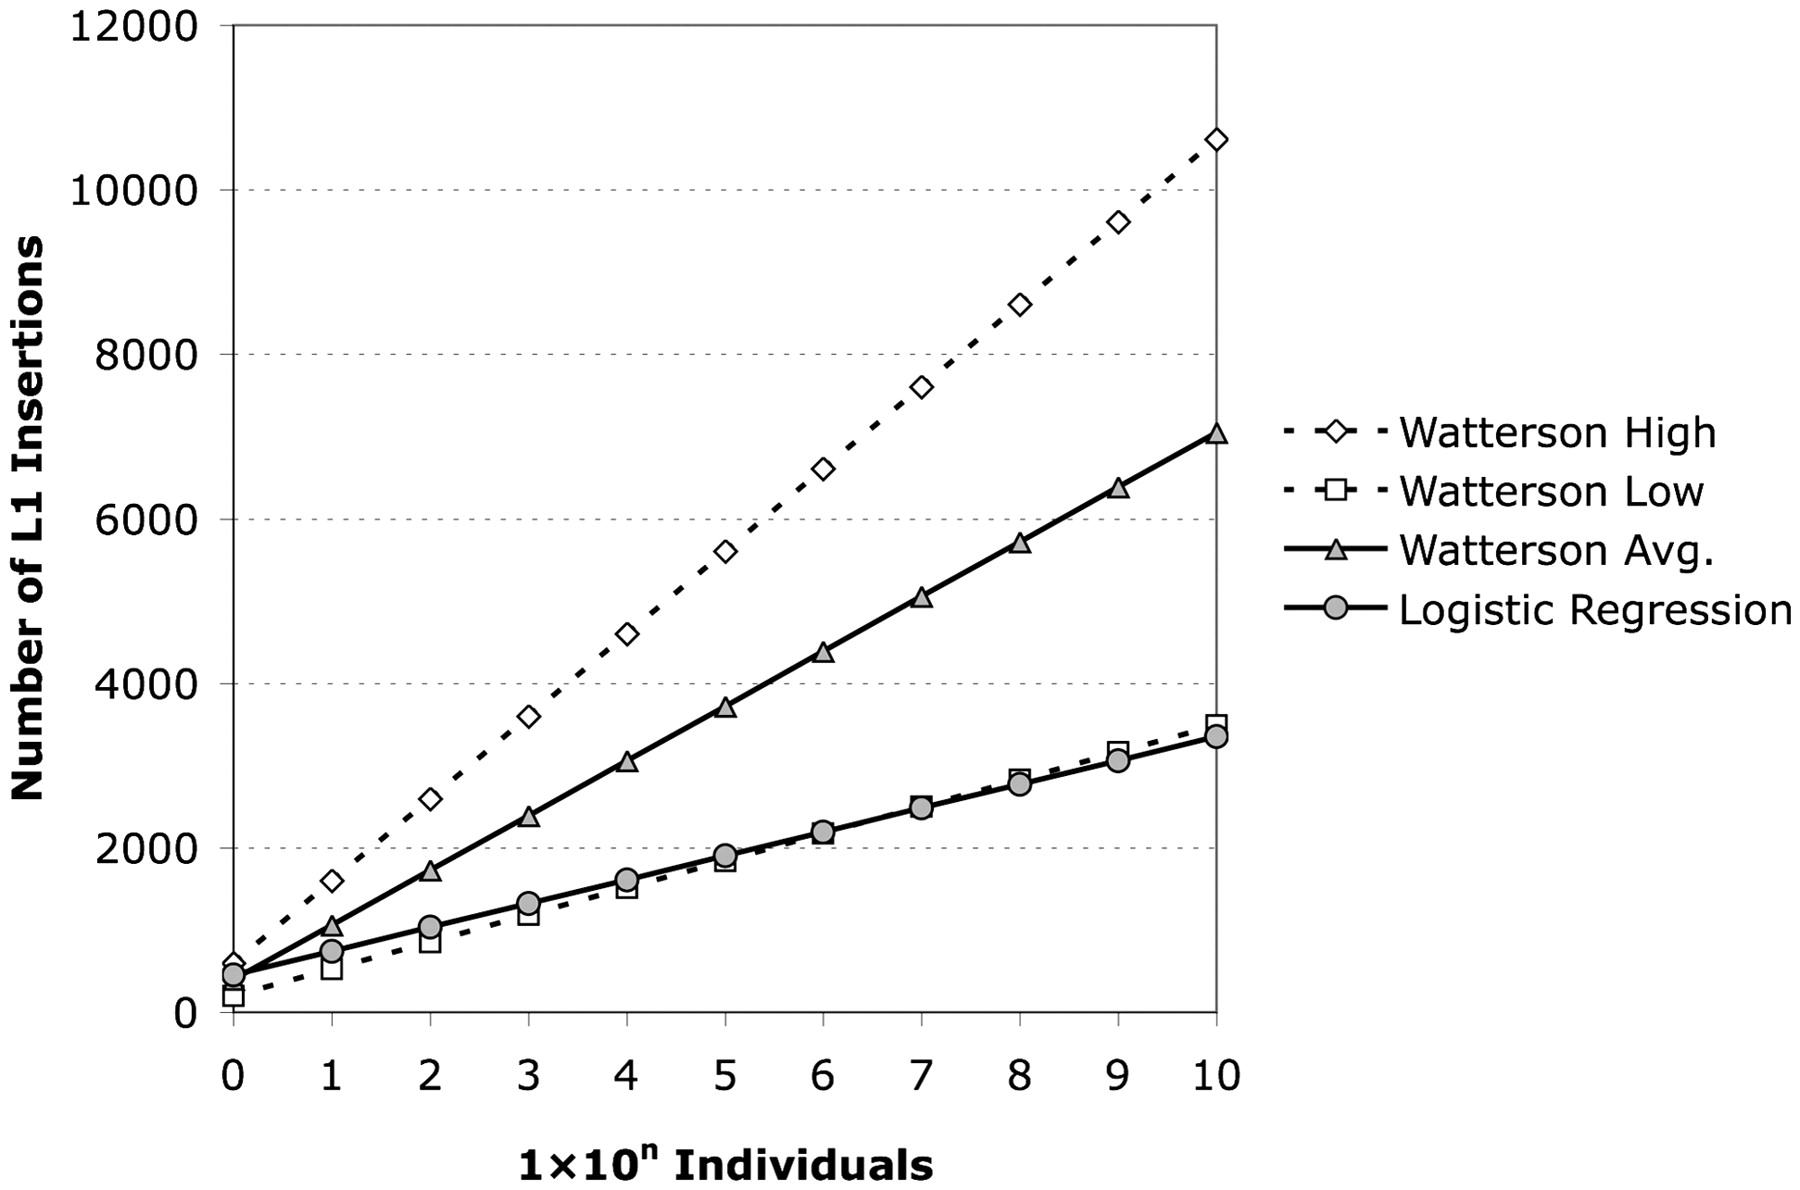
Figure 7.
Estimation of the number of L1Hs elements in humans. The various estimates discussed are plotted as log number of individuals versus number of L1Hs insertions predicted by the given model. The logistic regression model is plotted as gray circles, and the estimate based on segregating sites is plotted as gray triangles. The dotted lines indicate the upper (open diamonds) and lower (open squares) bounds for the estimate based on segregating sites calculated as described.


