
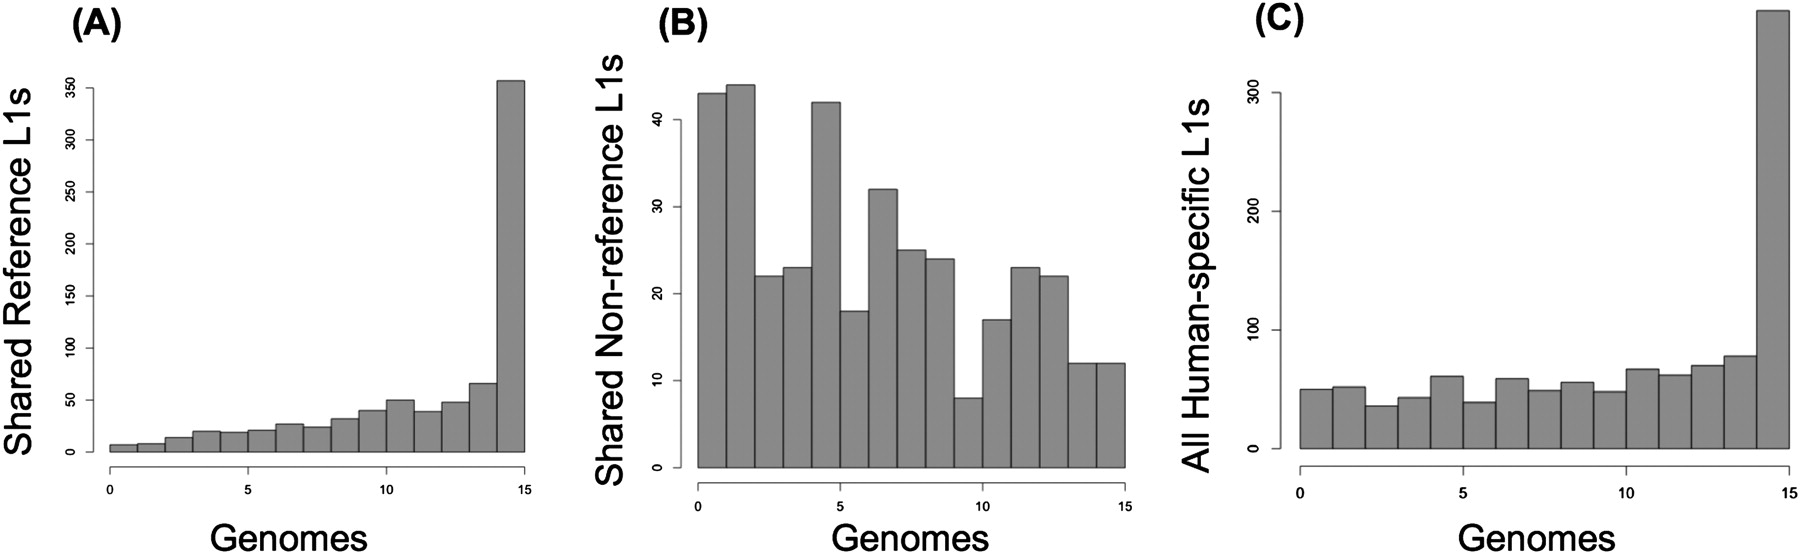
Figure 6.
Insertions shared between various numbers of individuals. Histograms for reference (A), nonreference (B), and combined reference and nonreference (C) L1 insertions are shown. The height of each bar represents the number of reference or nonreference insertions shared between the corresponding number of unrelated individuals (genomes). The y-axis (number of shared insertions) is scaled differently for reference and nonreference insertions.


