
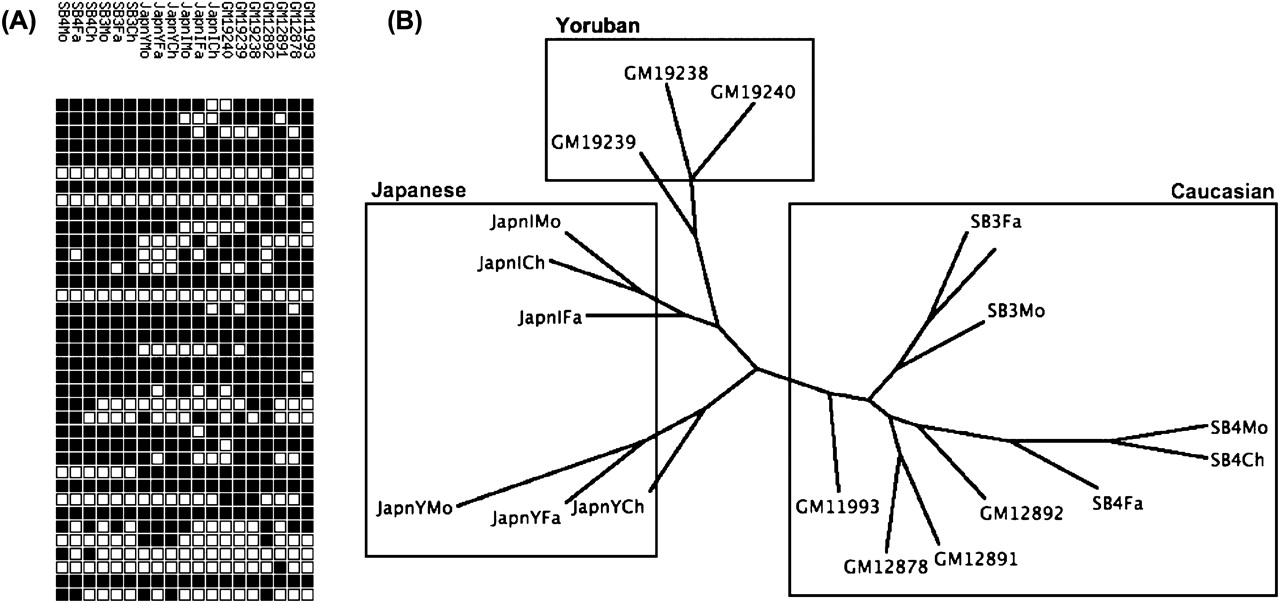
LINE-1 profiles recapitulate genetic ancestry. (A) Depiction of an L1 profile. Each row of squares corresponds to a different individual, and each column corresponds to an L1 insertion that exists in one or more individuals analyzed. A black square indicates the presence of an insertion at the corresponding site in the corresponding individual's genome. (B) Dendrogram representing the maximum parsimony relationship between 19 individuals (three pairs of Mz twins are excluded). Family trios are as follows: SB4Mo/Fa/Ch, SB3Mo/Fa/Ch, GM12891/92/78, JapnIMo/Fa/Ch, JapnYMo/Fa/Ch, GM19238/39/40. These individuals are members of Caucasian, Japanese, and Yoruba ethnic groups as indicated. Individuals prefixed with “GM” are from the Utah CEPH population.


