
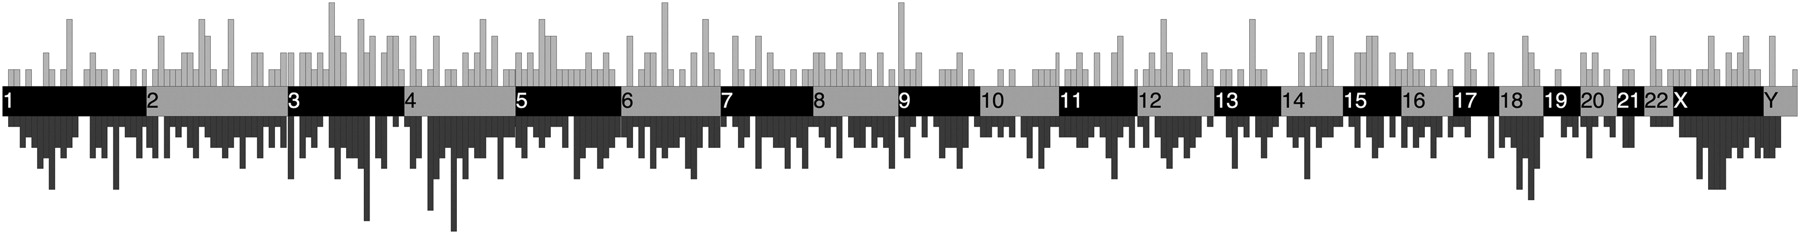
Figure 4.
Genomic distribution of reference and nonreference L1 insertions. Reference L1 insertions are shown below the genome; nonreference L1 insertions are shown above the genome. The width of each vertical bar corresponds to a 10-Mb window of a chromosome, represented by the alternating dark and light regions as indicated. The heights of the bins are normalized to be comparable across reference and nonreference bins.


