
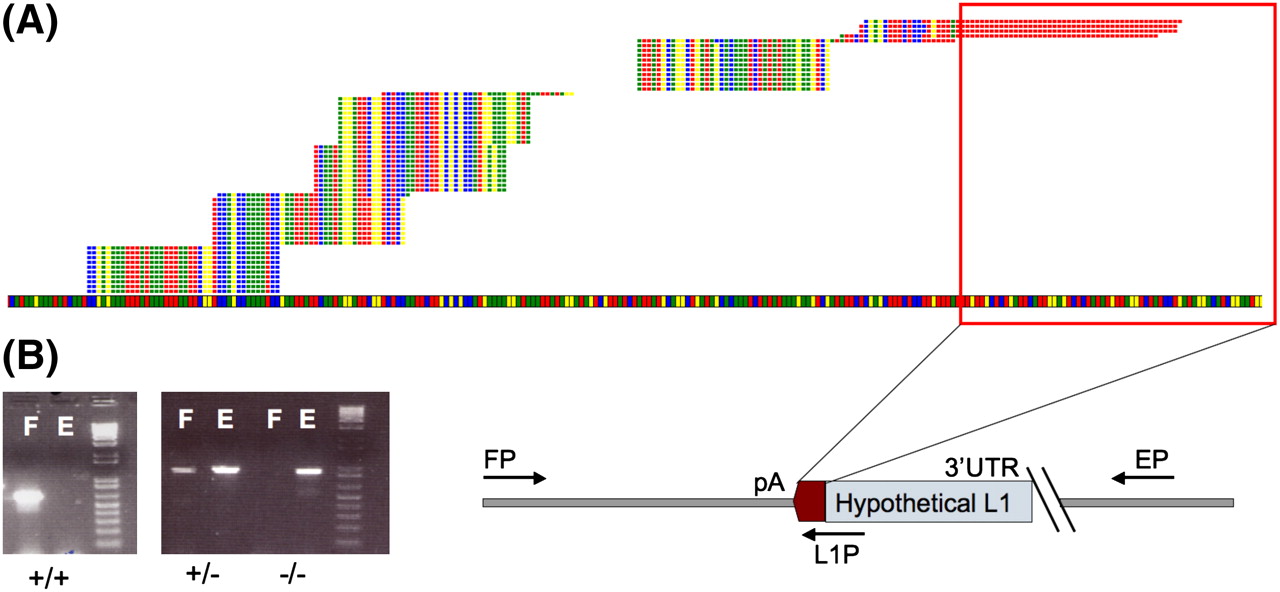
Validation of peaks resulting from the clustering of alignments. A typical sequence peak is indicated in A. The genome is represented as the colored band spanning the bottom of the figure, and the bases are represented as colored squares (T, red; A, yellow; G, blue; C, green). Stacks of reads are represented on top of the genome as aligned, with a maximum of five unique reads per alignment shown. Evidence for the presence of a polyadenylated sequence absent from the reference genome is indicated by the red outline, which corresponds to the 3′ polyA sequence associated with L1 insertions. The step-like appearance of the sequence peak is due to multiple binding sites for degenerate primers. (B) Genotyping PCR scheme used for the validation of insertions indicated by sequencing peaks. Primers FP and EP flank the expected insertion, indicated by the schematic L1 of unknown length. PCR using these two primers yields an empty site band E of a predetermined size in the cases where the L1 is heterozygous (+/−) for presence or absent entirely (false-positive, −/−). PCR using the AC-specific primer in the L1 3′ UTR (L1P) along with the FP primer yields a band corresponding to the presence of an L1 insertion F. Presence of the filled site, F, and empty site, E, indicates a heterozygous insertion, while presence of only the filled site band indicates homozygous insertion at the specific site. Bands shown on the gel are for three different sites.


