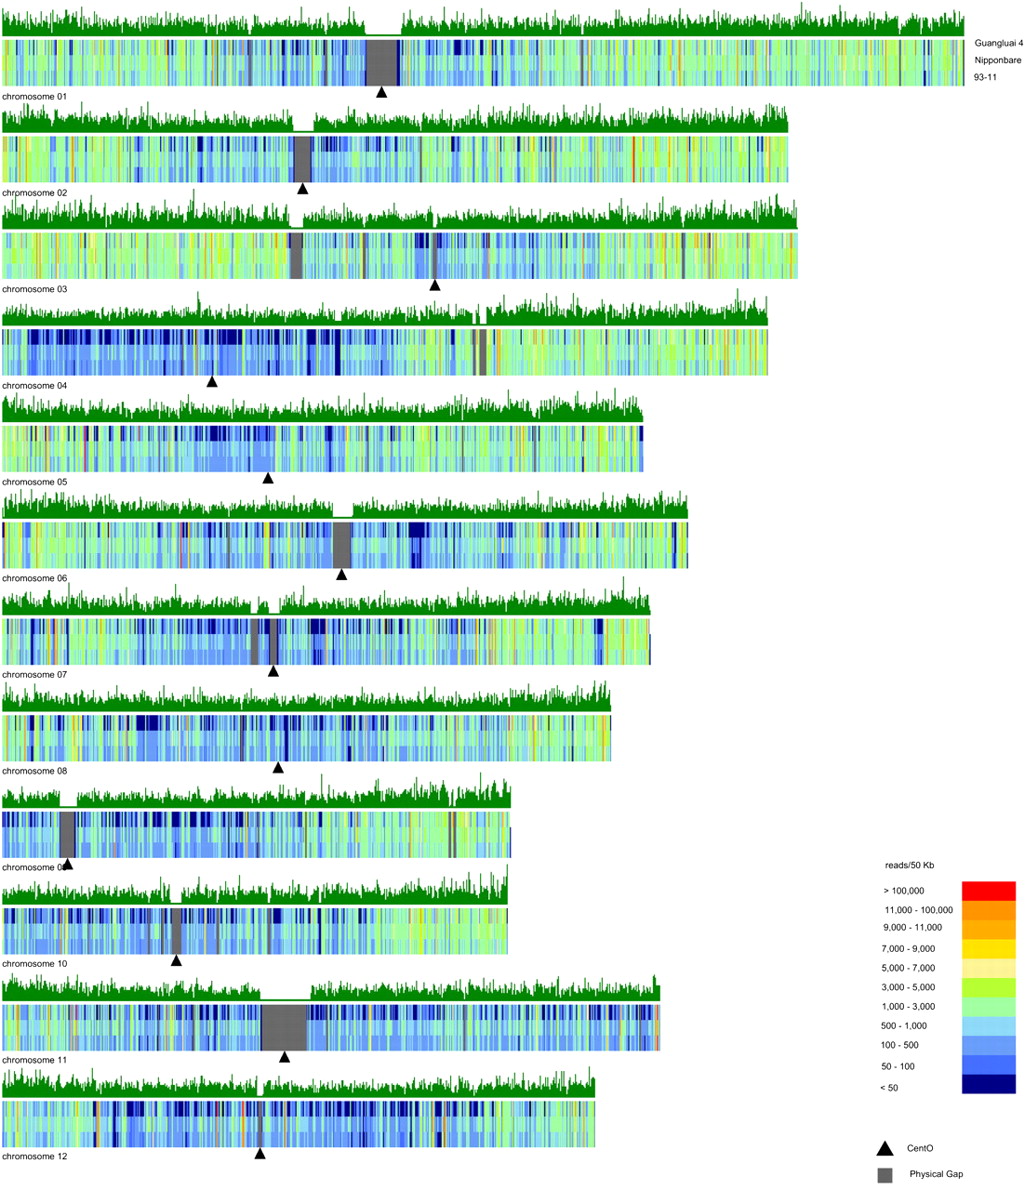
Function annotation of the rice transcriptome at single-nucleotide resolution by RNA-seq

(Downloading may take up to 30 seconds. If the slide opens in your browser, select File -> Save As to save it.)

Click on image to view larger version.

Figure 4.
Figure 4.

The genome distribution of transcribed regions in rice. Plots showing the number of mapped paired-end reads that was calculated in 50-kb windows along the 12 rice chromosomes are shown as color-coded vertical bars (see color index).

This Article

  1. Genome Res. 20: 1238-1249

Preprint Server