
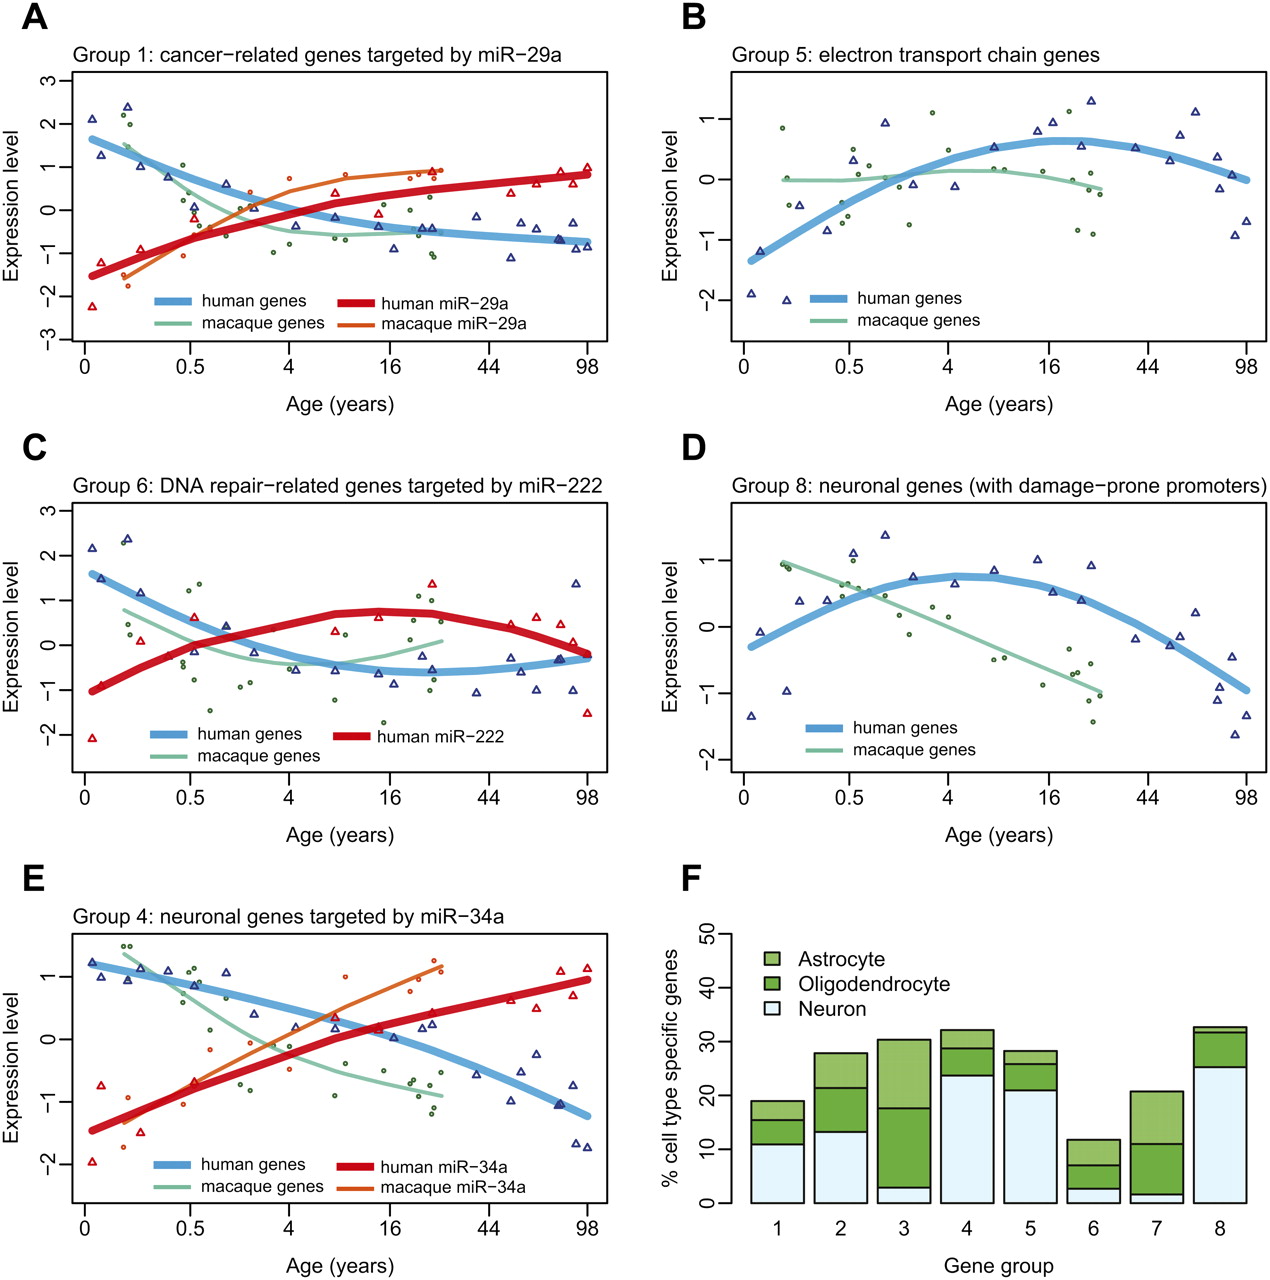
Functions, regulation, and specificity of coexpressed gene groups. Shown are mean expression profiles of selected genes within coexpressed gene groups, and their putative miRNA regulators. The empty triangles show mean standardized (z-transformed) human mRNA (blue) and miRNA (red) expression levels, while empty circles show mean standardized macaque mRNA (green) and miRNA (orange) expression levels (note the differences in timing of expression changes between human and macaque, for both mRNA and miRNA expression). The x-axis shows age of individuals on the (age)¼ scale. The lines correspond to cubic spline curves. The depicted genes are associated with specific Gene Ontology functional terms significantly enriched within the given coexpressed group. For A, C, and E, the genes are further targeted by specific miRNAs. (A) miR-29a and its four cancer-related targets in group 1 (MMP2, TRAF4, COL4A2, COL4A1). (B) Seventeen genes involved in electron transport in group 5. (C) miR-222 and its target in group 6, REV1, involved in DNA damage repair. (D) Fifty-seven neuronal genes in group 8. (E) miR-34a and its seven target neuronal genes in group 4 (GREM2, CAMSAP1, TANC2, CALN1, RGMB, FKBP1B, RTN4RL1). (F) Cell-type specificity of gene groups. The y-axis shows the percentage of cell-type-specific genes among the eight coexpressed age-related gene groups (based on Cahoy et al. 2008; see Methods).


