
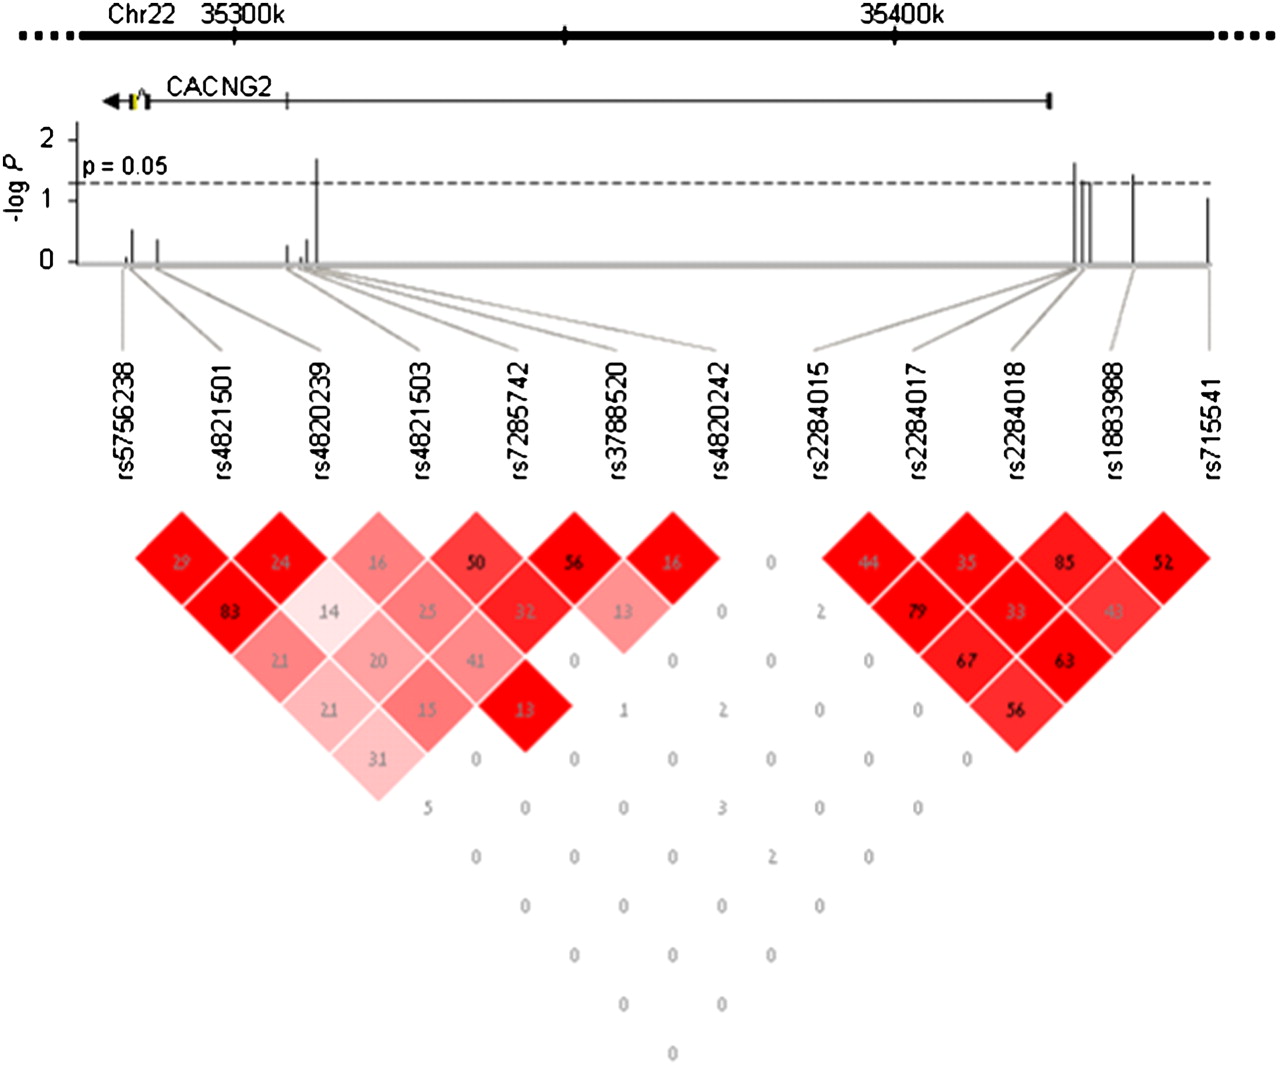
Figure 6.
Haplotype analysis of human CACNG2. The 12 SNPs used for genotyping human CACNG2 are listed, along with their map locations relative to the gene on human chromosome 22 (exons and gene orientation are indicated). The statistical significance of allele association with the pain phenotype (in −log P units) is plotted for each SNP. The dashed horizontal line is drawn at P = 0.05 (−log P = 1.3). The bottom part of the figure presents linkage disequilibrium (LD) patterns for the 12 SNPs. In each square, the LD r 2 value of the two SNPs that the square intersects is shown. The intensity of the color represents D′ (the higher D′, the darker the color of the square).


