
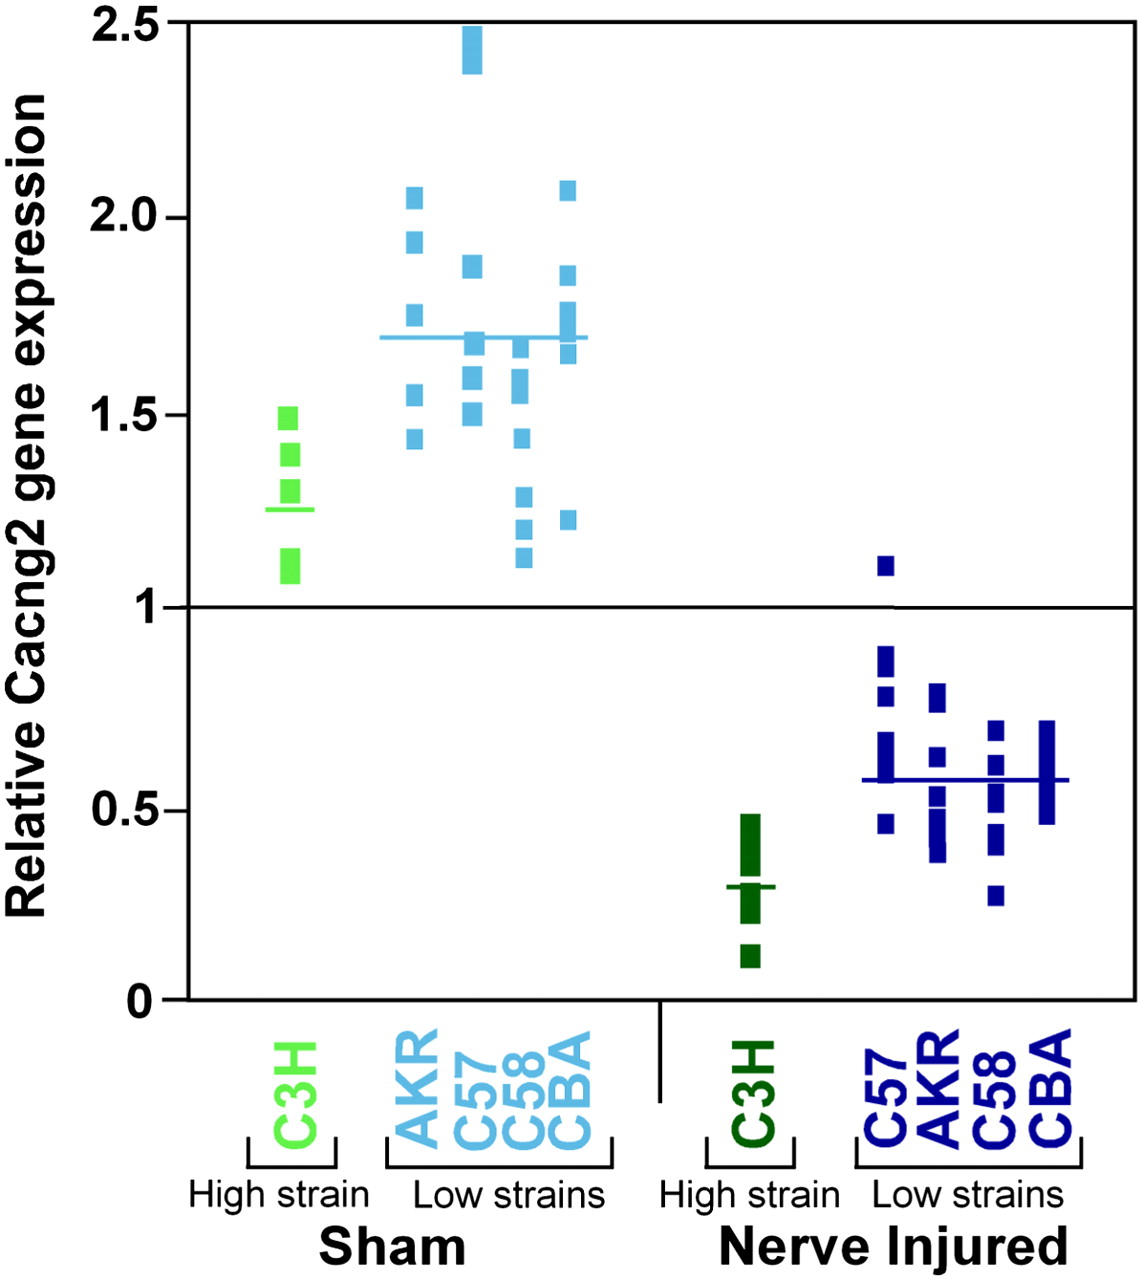
Cacng2 gene expression. For each mouse, the relative gene expression value at Cacng2 is shown (transcript 1440210_at/#BB342913). This is the expression value in a given mouse divided by the mean expression value across all mice. Results for the high autotomy strain C3H are shown for sham operated mice (light green) and nerve-injured mice (dark green). Results for the low autotomy strains C58, C57, CBA, and AKR are shown for sham-operated mice (light blue) and nerve-injured mice (dark blue). The Cacng2 expression average for each group is represented by a horizontal line. For reference, the horizontal line drawn at 1 represents the mean Cacng2 expression level of all mice.


