
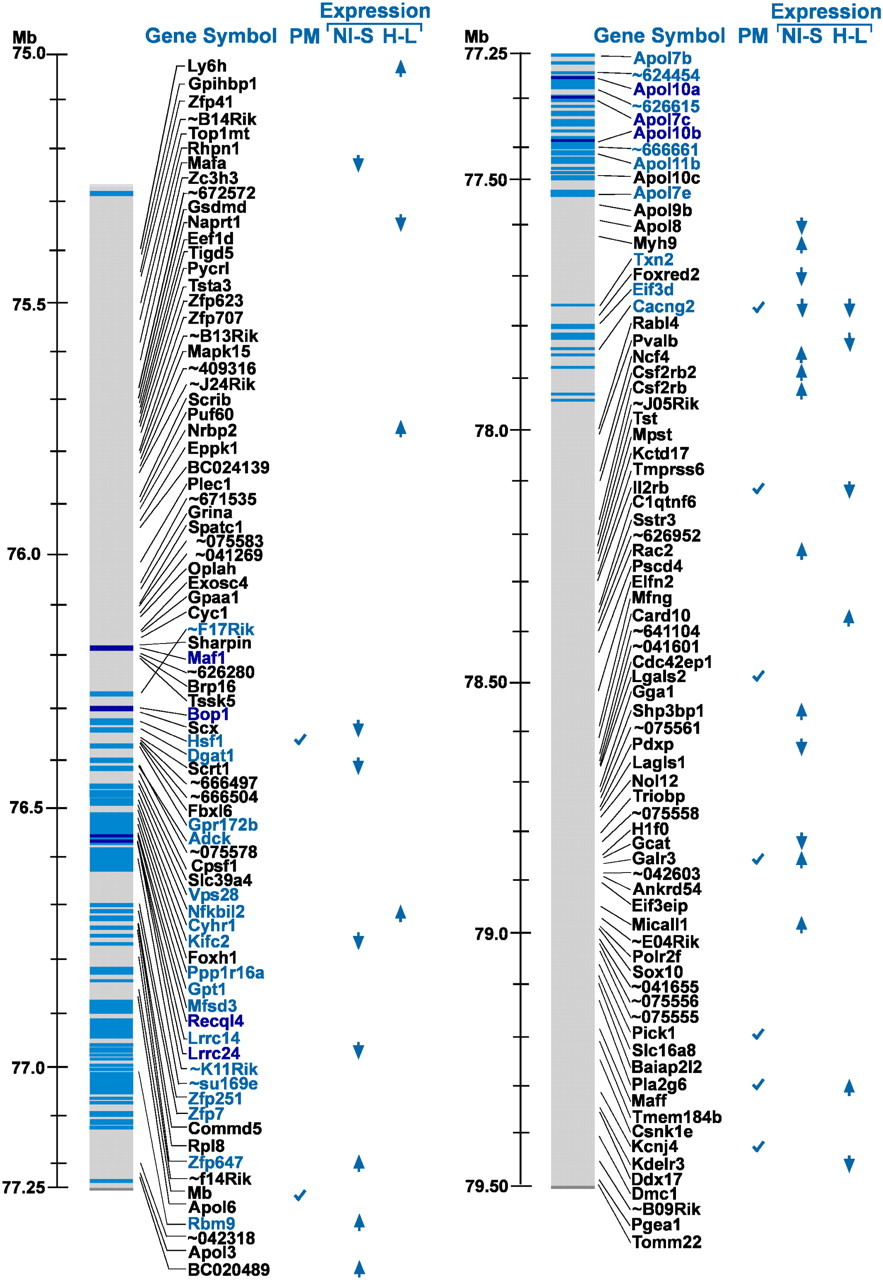
Integrative analysis of the 155 genes within the Pain1-containing interval. The gene names and their location on mouse chromosome 15 are shown on the left gray bar. (Blue bars) SNPs with a complete cosegregation among the seven mouse strains (see text); (dark blue bars) coding nonsynonymous SNPs; (light blue) other SNPs. Predicted/annotated genes and hypothetical protein names (long names) are given as “∼xxxxxx” (where xxxxxx is the six last characters of the gene name). For the full name, see Supplemental Table S3. The column “PM” indicates genes found to be related to pain physiology in a PubMed search. The columns “NI-S” (NI, nerve-injured; S, sham) and “H-L” (H, high autotomy; L, low autotomy) highlight genes with significant expression-fold change (the direction of the arrowheads indicates up-regulation or down-regulation). The “NI-S” column presents the results for the nerve-injured versus sham comparison, and the “H-L” column presents the results for the high-autotomy versus the low-autotomy strains.


