
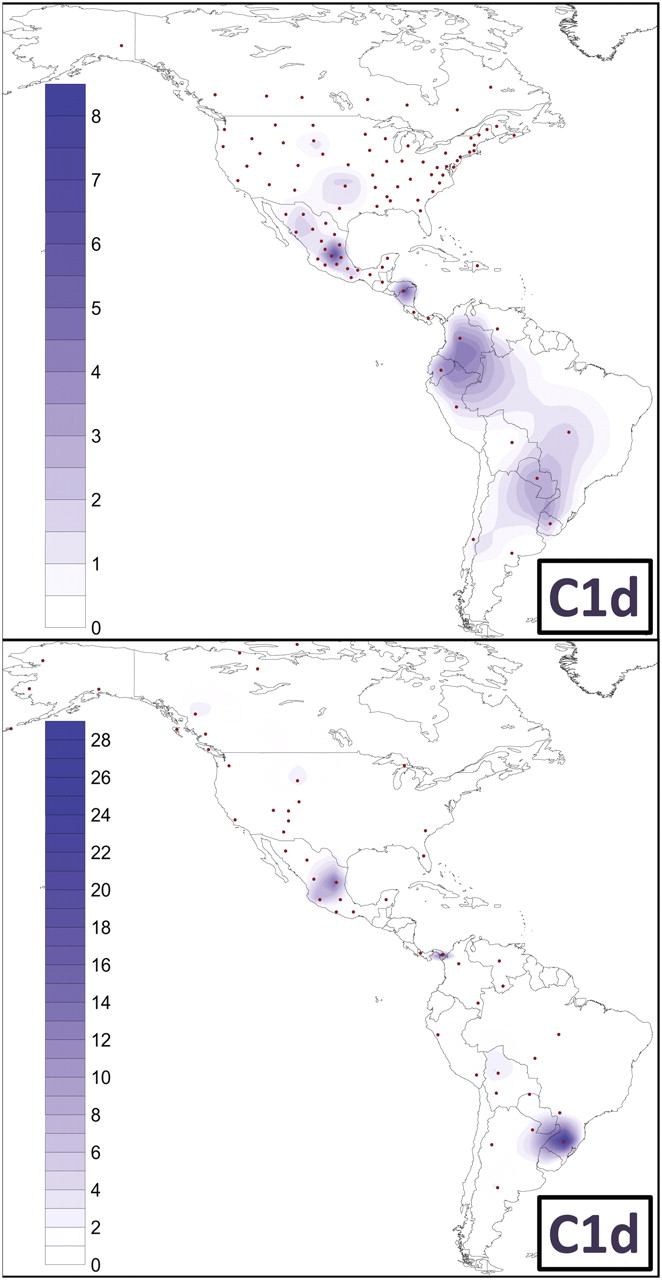
Figure 3.
Spatial frequency distribution of haplogroup C1d. The top map shows the frequency distribution of haplogroup C1d in general mixed populations of national states, while the bottom map illustrates the distribution in Native American tribes or communities. Note that the frequency scales (%) used in the two maps are different. The dots indicate the geographic location of the population samples included in each survey (Supplemental Tables S2, S3). Frequency maps were obtained as in Pala et al. (2009).


