
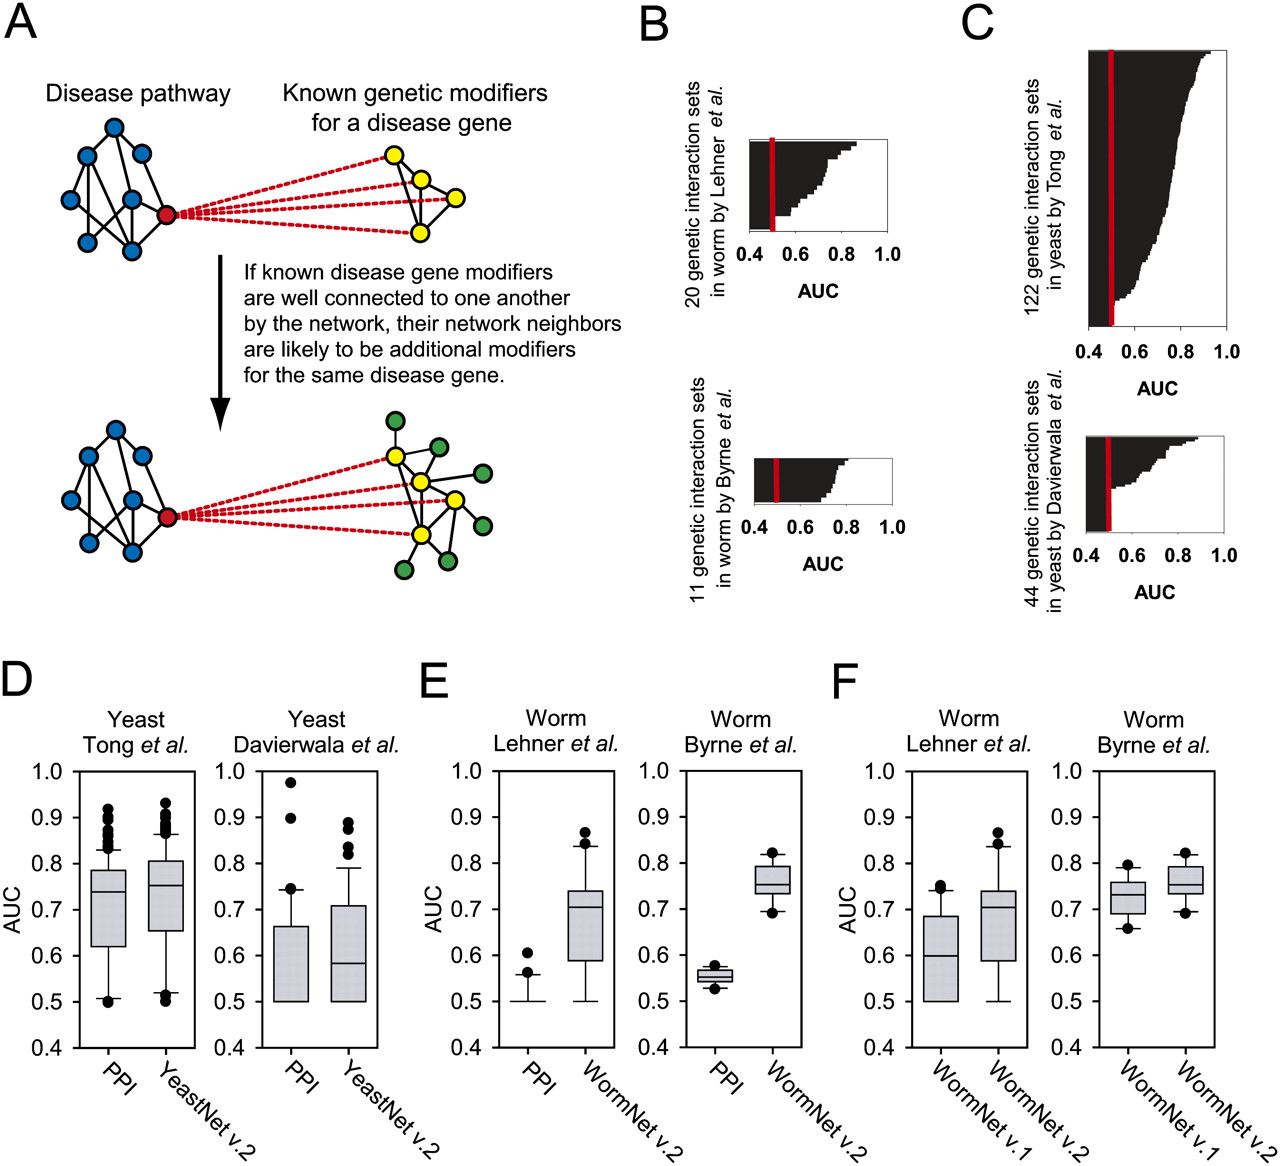
Network-guided prediction of genetic modifiers. (A) A schematic figure of network-guided prediction of genetic modifiers. Assuming there are some known disease gene modifiers (yellow nodes) for a disease gene (red node), we can predict additional candidate genetic modifiers (green nodes) connecting to known genetic modifiers in the functional gene network, because genes with similar functions tend to share genetic interaction partners (here, the disease gene). (B) AUC of known genetic modifiers for worm genes from two independent screens. The majority of groups of congruent genes show high AUC score (e.g., AUC > 0.6). AUC for random expectation (AUC = 0.5) is indicated by red line. (C) AUC of known synthetic lethal partners for yeast genes, from two independent studies—one for nonessential genes and the other for essential genes. These also show high predictability, indicated by high AUC scores for the majority of groups (red line for AUC = 0.5). (D) Predictability for synthetic lethal partners for yeast nonessential genes or essential genes by protein–protein interaction or functional gene network. In bar-and-whiskers plots, the central horizontal line in the box indicates the median AUC, and the boundaries of the box indicate the first and third quartiles of the AUC distribution, whiskers indicate the 10th and 90th percentiles, and filled circles indicate individual outliers. (E) Same analysis as D for genetic modifiers of worm orthologs of human disease genes. (F) Comparison of predictability between two different versions of WormNet.


