
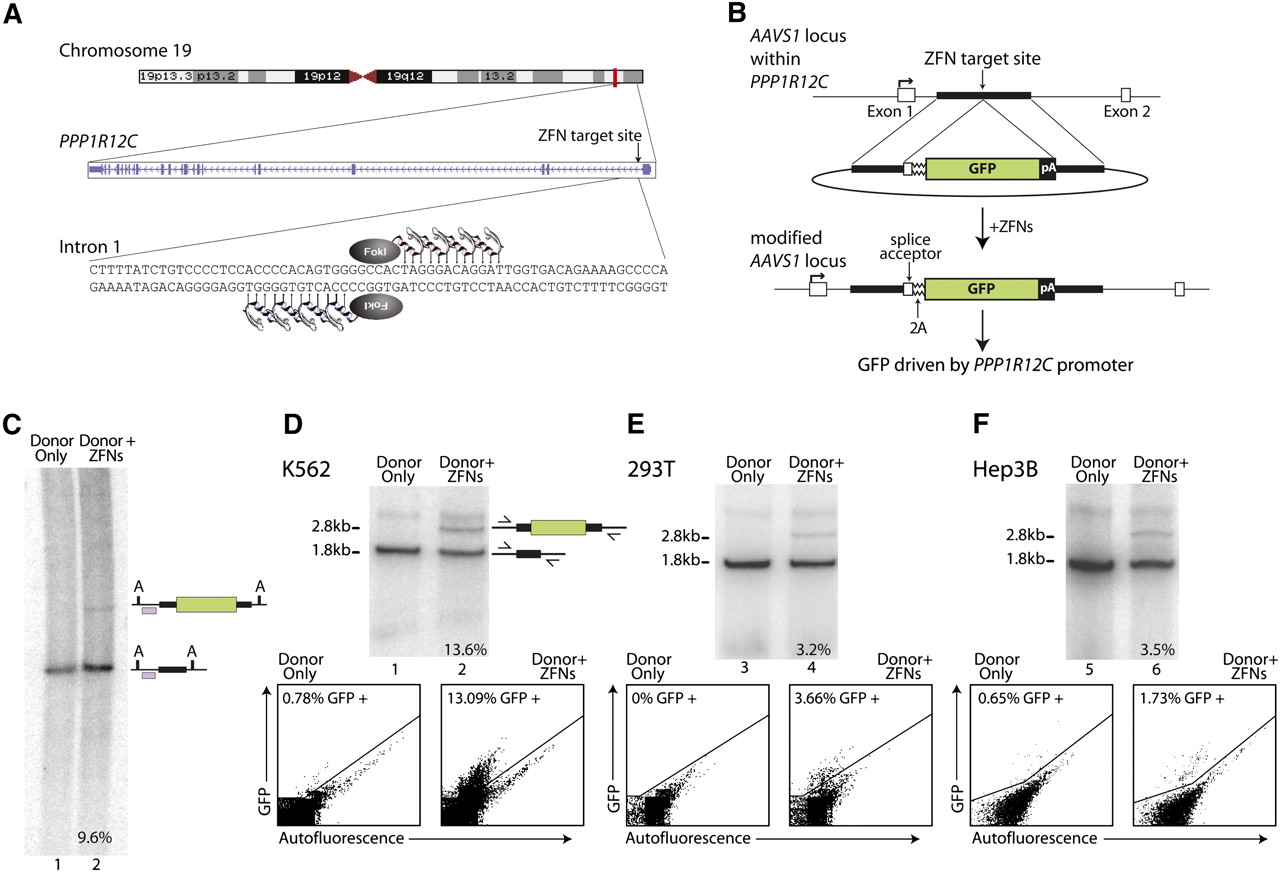
ZFN-driven ORF addition to the PPP1R12C gene (also known as the AAVS1 locus) in various transformed cell types: (A) Schematic of the human PPP1R12C gene (http://www.genome.ucsc.edu), with the exon/intron structure and the ZFN target site indicated. (B) Schematic of donor construct and of the AAVS1 locus following GFP marker ORF addition. The first two exons of the PPP1R12C gene are shown as open boxes. Also annotated are the locations of the splice acceptor site, the 2A ribosome stuttering signal, and a polyadenylation signal (pA). (C) Southern blotting confirms efficient ZFN-dependent ORF addition to the AAVS1 locus in K562 cells. The positions of wild-type and transgenic chromatids are indicated to the right of the gel; the percentage of transgenic chromatids in this cell pool is indicated below lane 2. The PhosphorImager traces used for the quantitation are shown in Supplemental Figure 1. The probe used for Southern blotting, which corresponds to positions chr19:55,628,340–55,628,753 (GRCh37/hg19) is indicated as a purple-filled box; “A” indicates recognition sites for AccI that genomic DNA was cut with for this Southern. (D) Efficient ZFN-driven GFP ORF addition to AAVS1 in K562 cells. Results of a semiquantitative, body-labeled PCR-based assay (see Methods) on cells transfected with the indicated constructs are shown. Primers are located outside of the homology arms and are indicated on the schematic to the right of the gel. The positions of wild-type and transgenic chromatids are indicated to the right of the gel. The frequency of genome-edited chromatids is indicated below each lane. In this assay, when applied to this locus, weak nonspecific incorporation during early PCR cycles produces a band that appears in all samples and migrates above the one generated by the transgenic chromatid. The data below the autoradiograph represent analysis of the frequency of GFP-positive cells by FACS in the same cells genotyped above. (E) As in D, except HEK293T cells were used. (F) As in D, except Hep3B cells were used.


