
Figure 1.
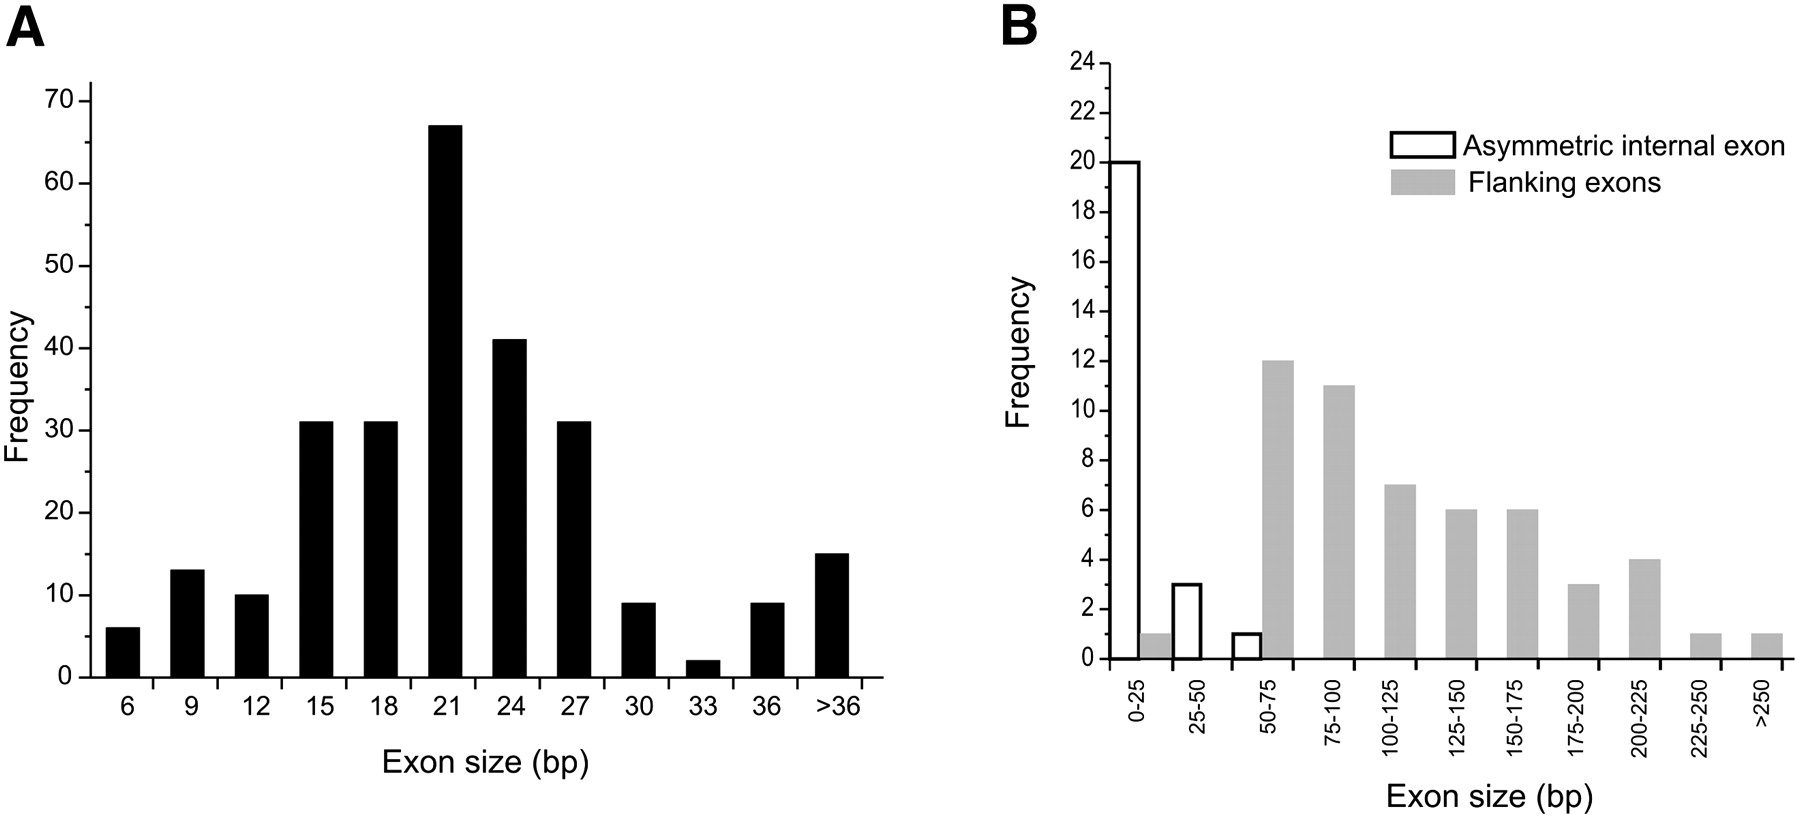
Exon size distribution in S. mansoni micro-exon genes. (A) Histogram of the symmetrical internal exon size distribution. (B) Histogram of asymmetrical internal exon and flanking exon sizes.
(Downloading may take up to 30 seconds. If the slide opens in your browser, select File -> Save As to save it.)
Click on image to view larger version.
Exon size distribution in S. mansoni micro-exon genes. (A) Histogram of the symmetrical internal exon size distribution. (B) Histogram of asymmetrical internal exon and flanking exon sizes.
 CiteULike
 Delicious
 Digg
Digg Facebook
 Google+
 Reddit
 Twitter
