
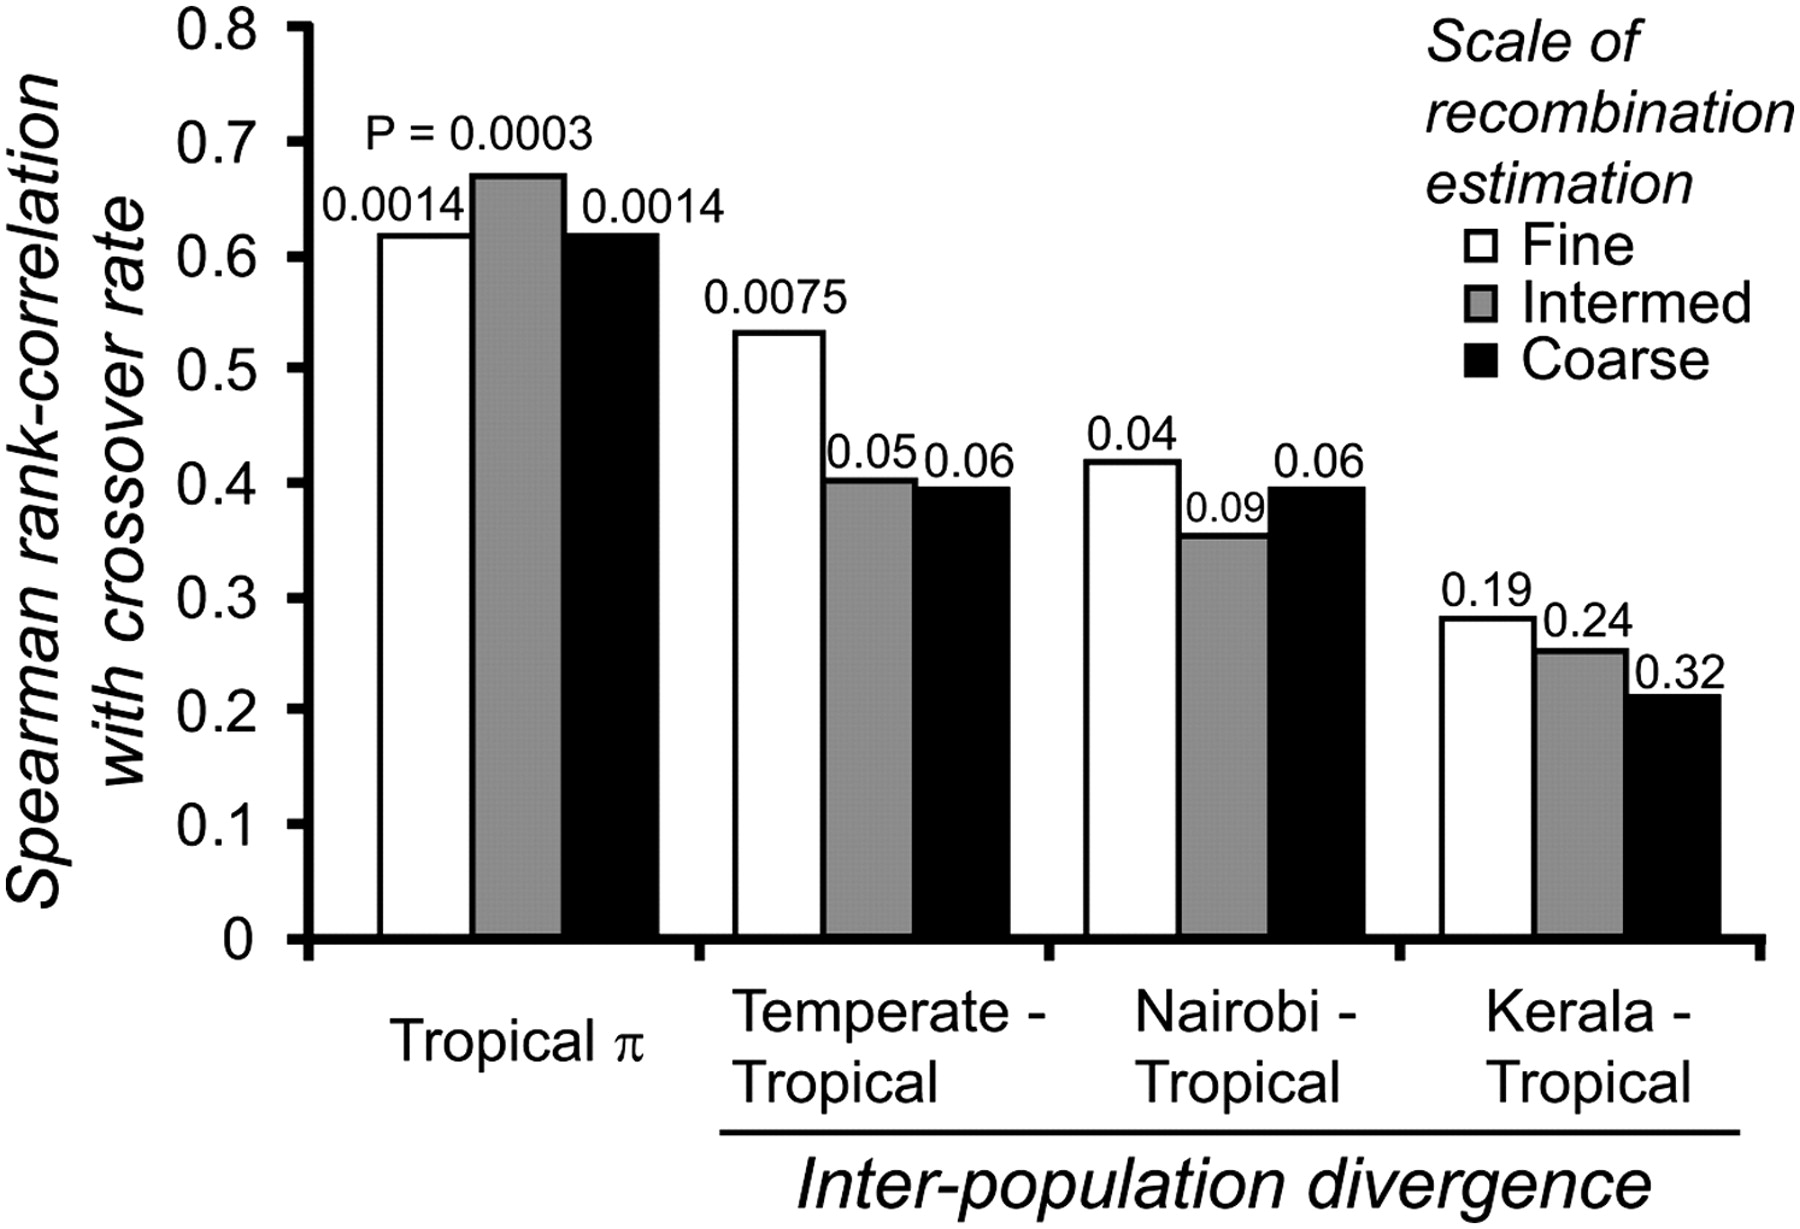
Figure 5.
The correlation between crossover rate and interpopulation divergence is stronger for comparisons of more closely related populations and in analyses using finer-scale estimates of crossover rate. P-values are indicated above the bars.


