
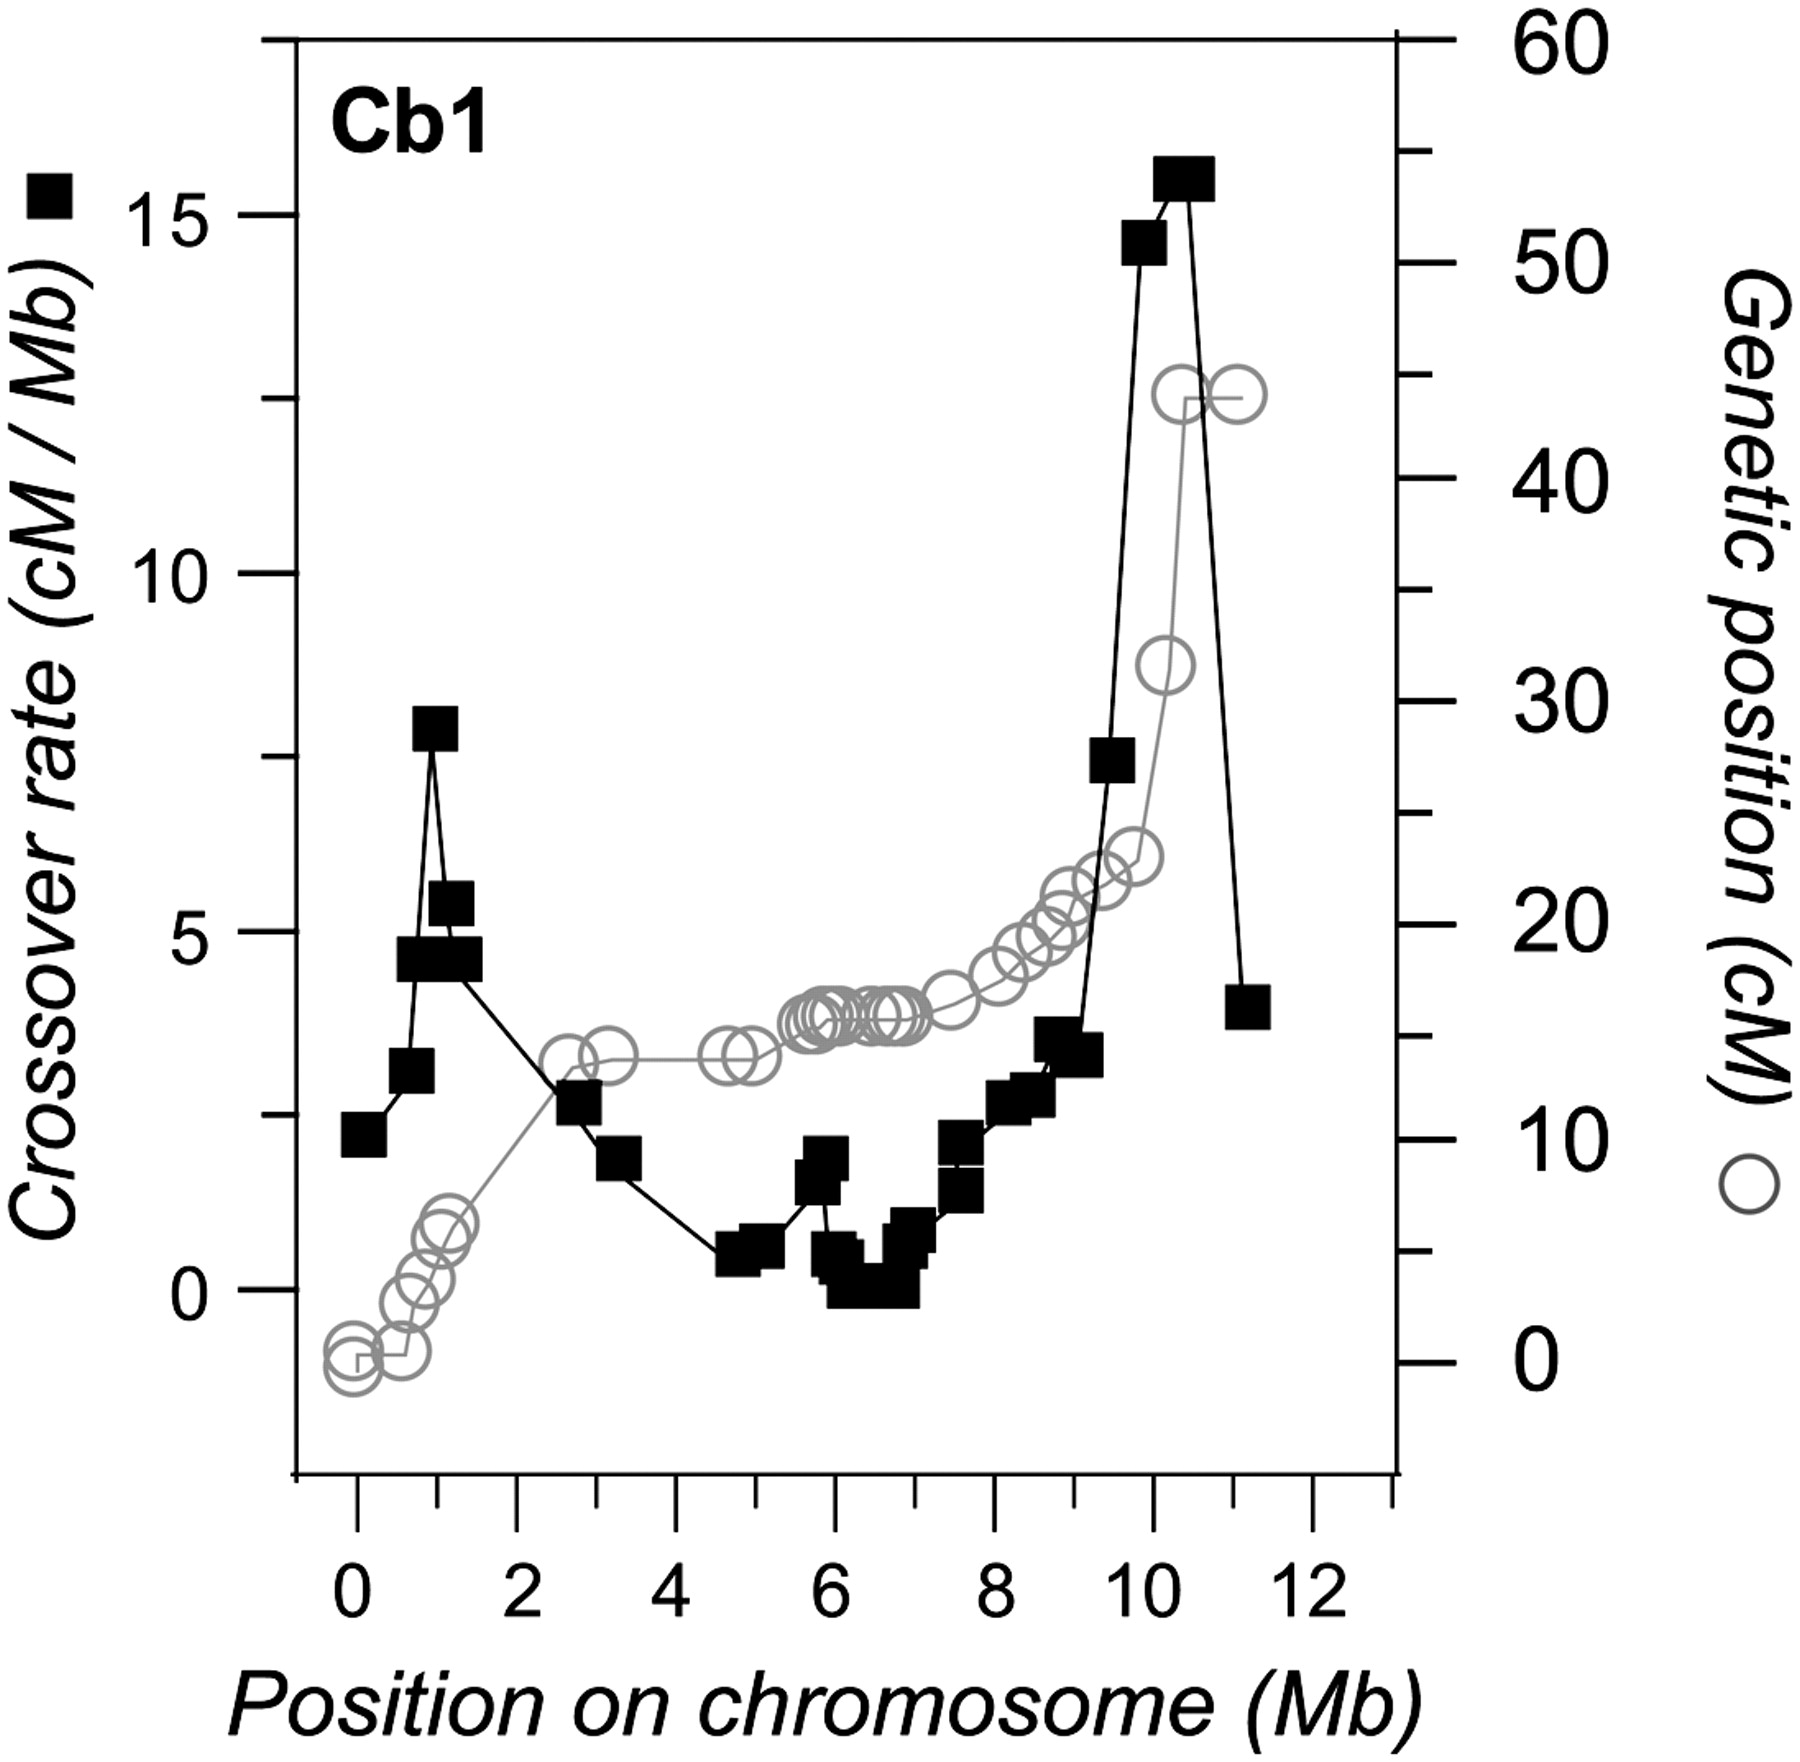
Figure 2.
Crossover rate estimates for C. briggsae chromosome 1 with each point-estimate based on the slope of the least-squares regression line through five mapped loci. Other chromosomes have similar marker density and general recombination profiles (Supplemental Fig. 2). Finer- and coarser-scale estimation of crossover rates are qualitatively similar, as well (Supplemental Fig. 1B). Note that the low-recombination chromosome centers do not correspond to centromeres, as centromeres are not distinct features of Caenorhabditis chromosomes.


