
Figure 1.
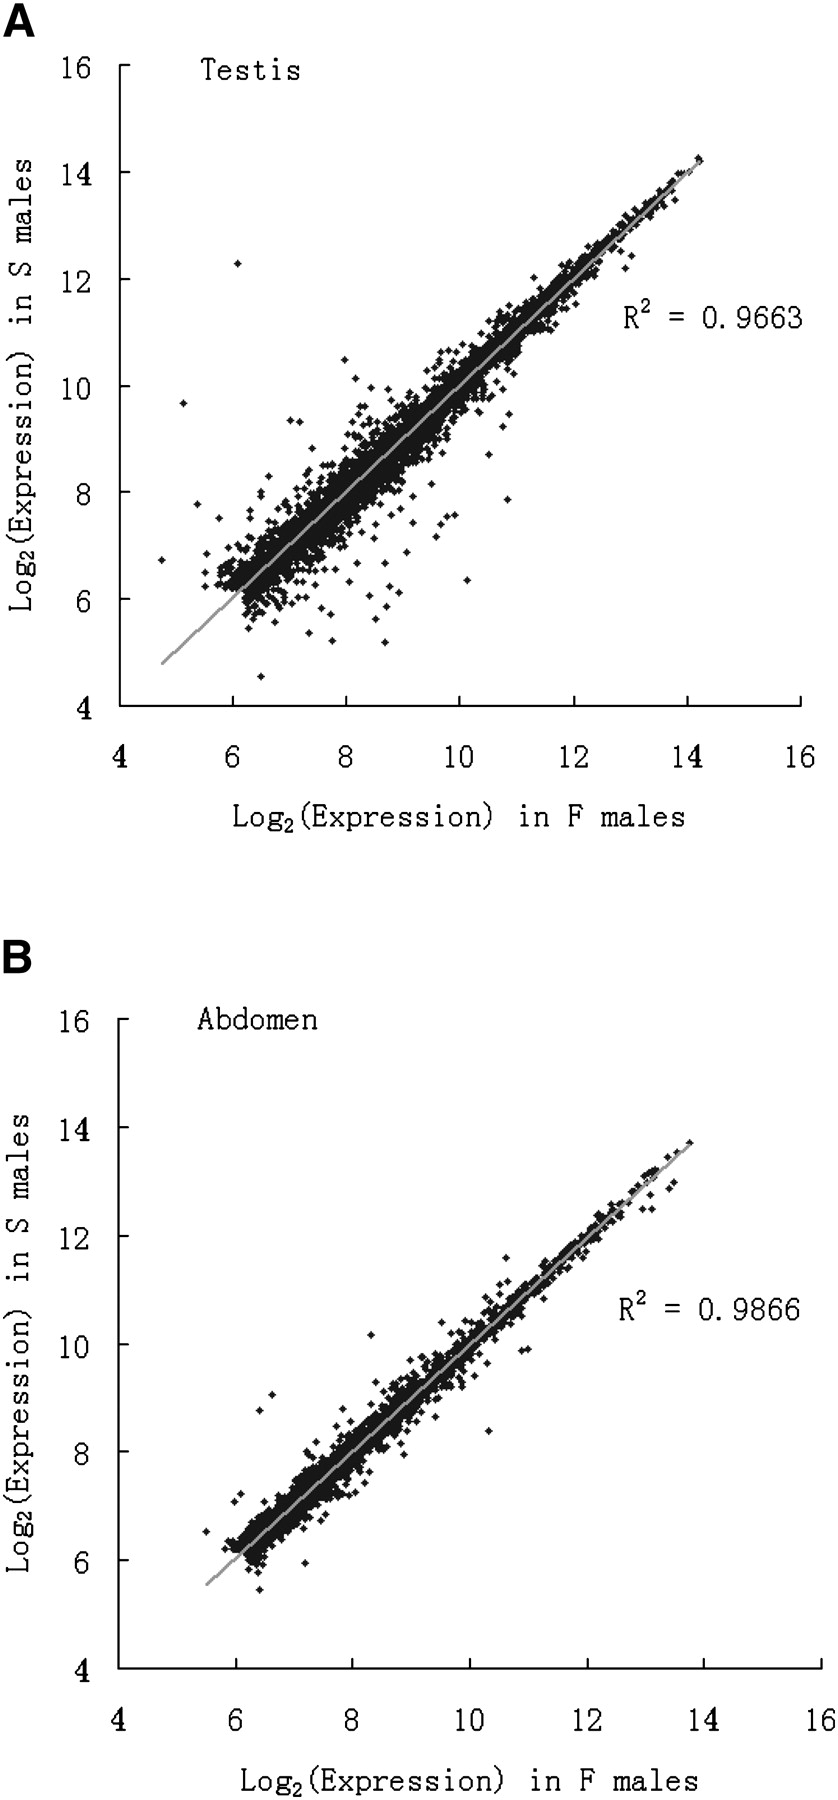
The correlation in the expression level of F and S males in testis (A) and abdomen (B). B serves as the negative control (see text).
(Downloading may take up to 30 seconds. If the slide opens in your browser, select File -> Save As to save it.)
Click on image to view larger version.
The correlation in the expression level of F and S males in testis (A) and abdomen (B). B serves as the negative control (see text).
 CiteULike
 Delicious
 Digg
Digg Facebook
 Google+
 Reddit
 Twitter
