
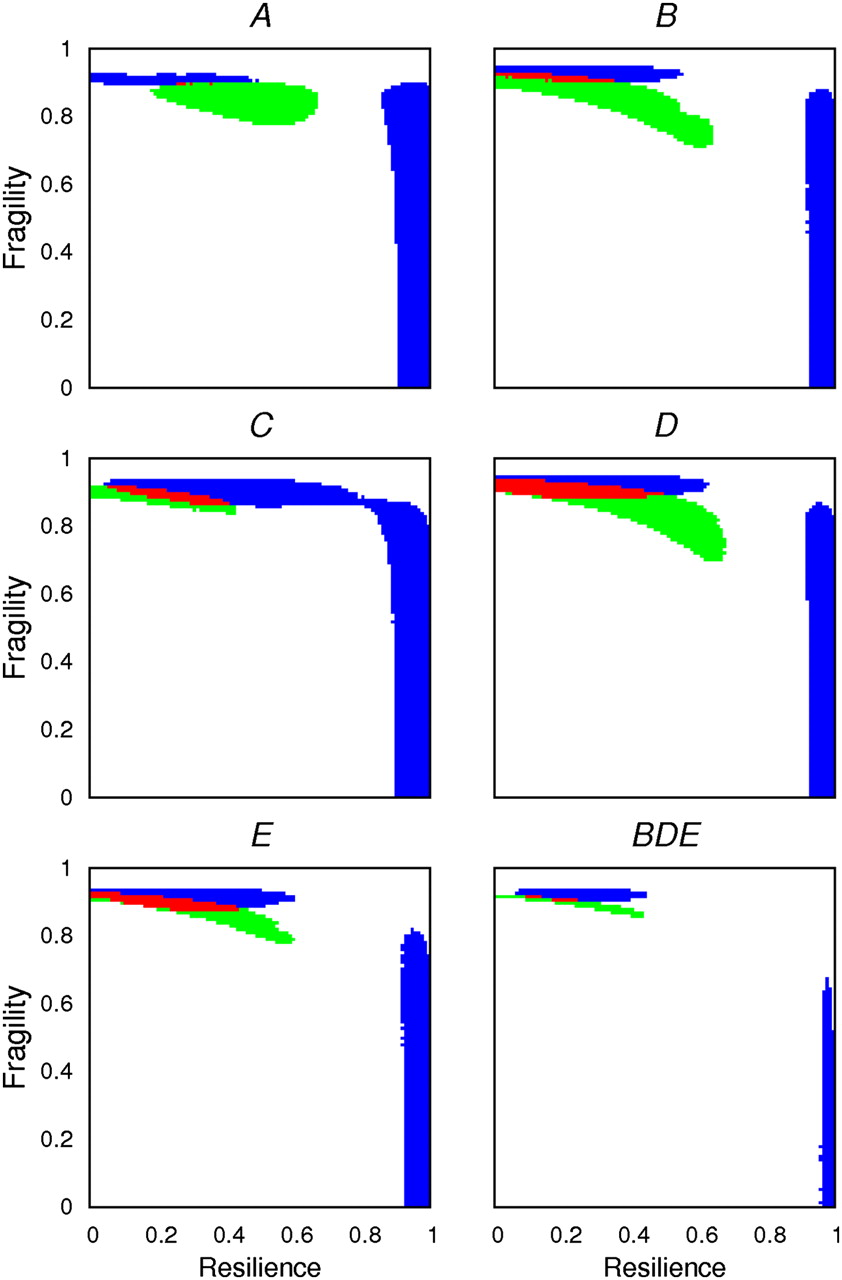
Heat map showing under which simulated conditions two key diagnostic features of chromosome evolution can be recapitulated by computer simulations. High levels of fragility and low levels of resilience yield the best recapitulation of the observed data. The existence of different degrees of resilience and fragility are simulated in steps of 0.01 according to their modes R2 and F1, respectively (Methods). For each Muller's element (A–E), a combination of elements B, D, and E (BDE), and resilience/fragility value, 1000 simulations were done in which IGA order was reshuffled by a number of inversions equal to that estimated with MGR. The resulting distributions for the number of neighboring orthologous landmarks and for the size of orthologous landmarks are compared with those observed using a G-test. (White) Statistically significant differences for both the distribution of the number of neighboring orthologous landmarks and for that of the size of orthologous landmarks; (blue) statistically significant differences for the number of neighboring orthologous landmarks only; (green) statistically significant differences for the size of the orthologous landmarks only; and (red) statistically significant differences neither for the size of the orthologous landmarks nor for the number of neighboring orthologous landmarks, that is, the observed distributions are recapitulated. In this particular case, constraints and fragile regions were assumed to be invariant during the simulations performed. The William's correction was applied to all the G-tests performed.


