
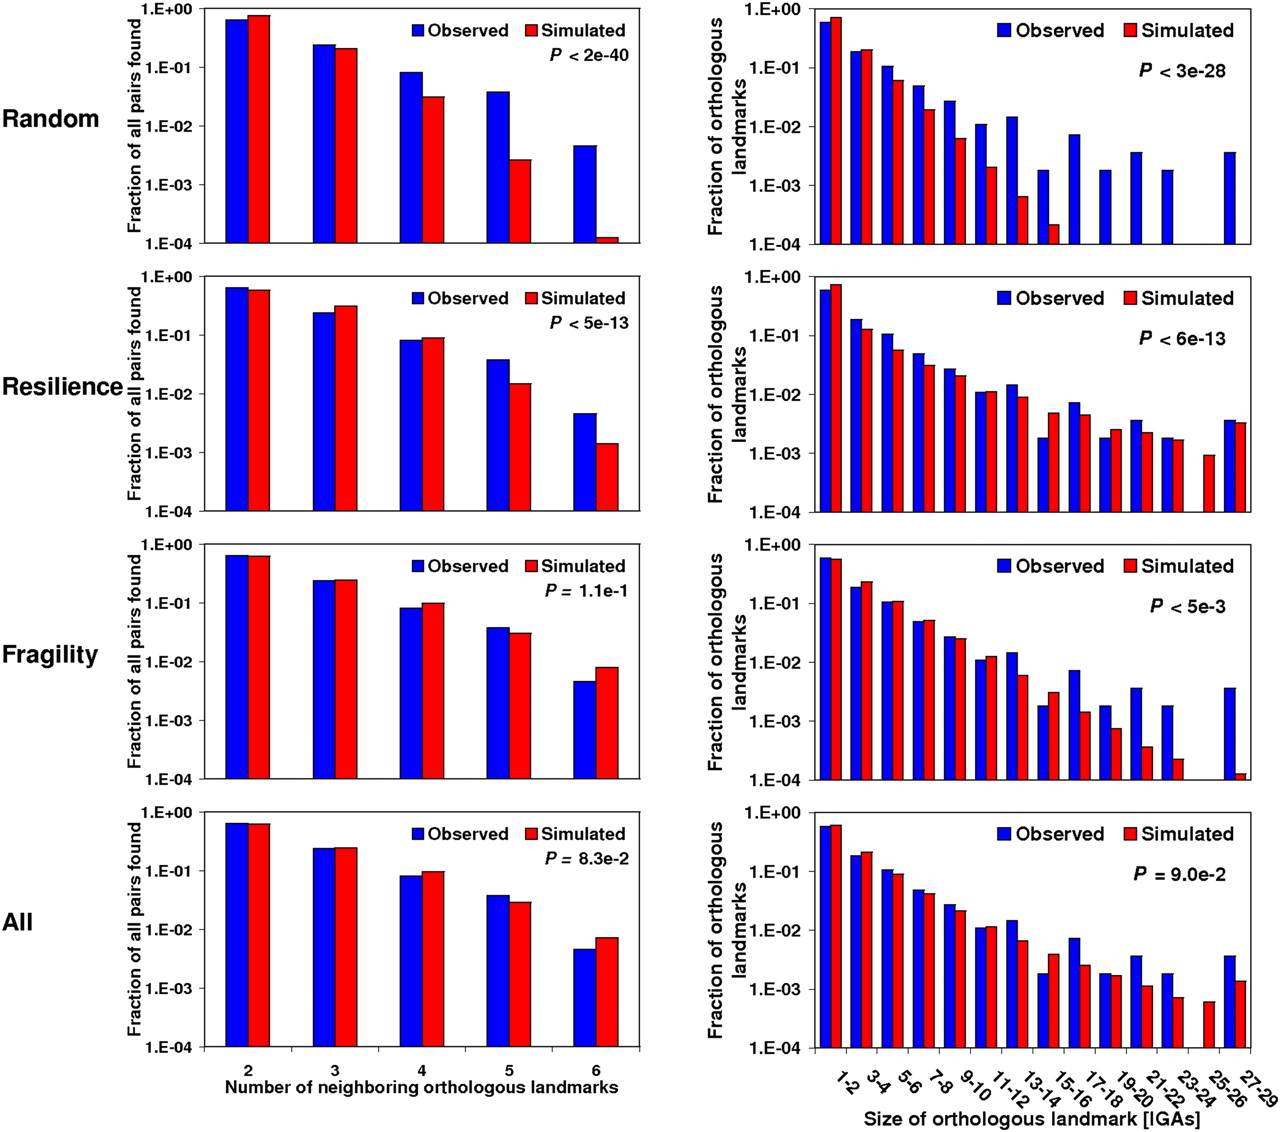
Test to the mode of evolution for Muller's element C. Comparisons were made between the observed and simulated distributions, under four different modes of evolution, for the number of neighboring orthologous landmarks (left) and the size of orthologous landmarks (right). The distribution of the simulated data is obtained from 1000 simulations in which a chromosomal element has the same organizational features as those of Muller's element C, which is subjected to 571 chromosomal inversions, i.e., the estimate obtained from MGR. First, we show the random breakage model, which is characterized for breakages occurring at random along the chromosomes. None of the distributions are recapitulated, in part because of an excess of multiple breakpoints and large orthologous landmarks in the observed data. Second, we show a mode of evolution in which constraints prevent some genomic regions from being broken. The results for the optimum degree of resilience (r = 0.77), that for which the best fit is found for observed and simulated distributions, are shown. Notice especially the excess of multiple breakpoints observed in relation to those expected (left). Third, we show a mode of evolution in which some genomic regions tend to flank inversion breakpoints. The results for the optimum degree of fragility (f = 0.94) are shown. Notice especially the excess of large HCBs observed in relation to those expected (right). Fourth, we show a mode of chromosome evolution in which resilience and fragility coexist. The results for the optimum combination of degree of resilience and fragility (r = 0.14; f = 0.92) are shown. In this case, no statistically significant difference is found between the observed and simulated distributions. The particular ways in which constraints and fragile regions were simulated correspond to R2 and F1 (Supplemental Table S30). Units on the y-axes are expressed on a logarithmic scale. Supplemental Figure S21 shows equivalent comparisons for the remaining Muller's elements and combinations of them.


