
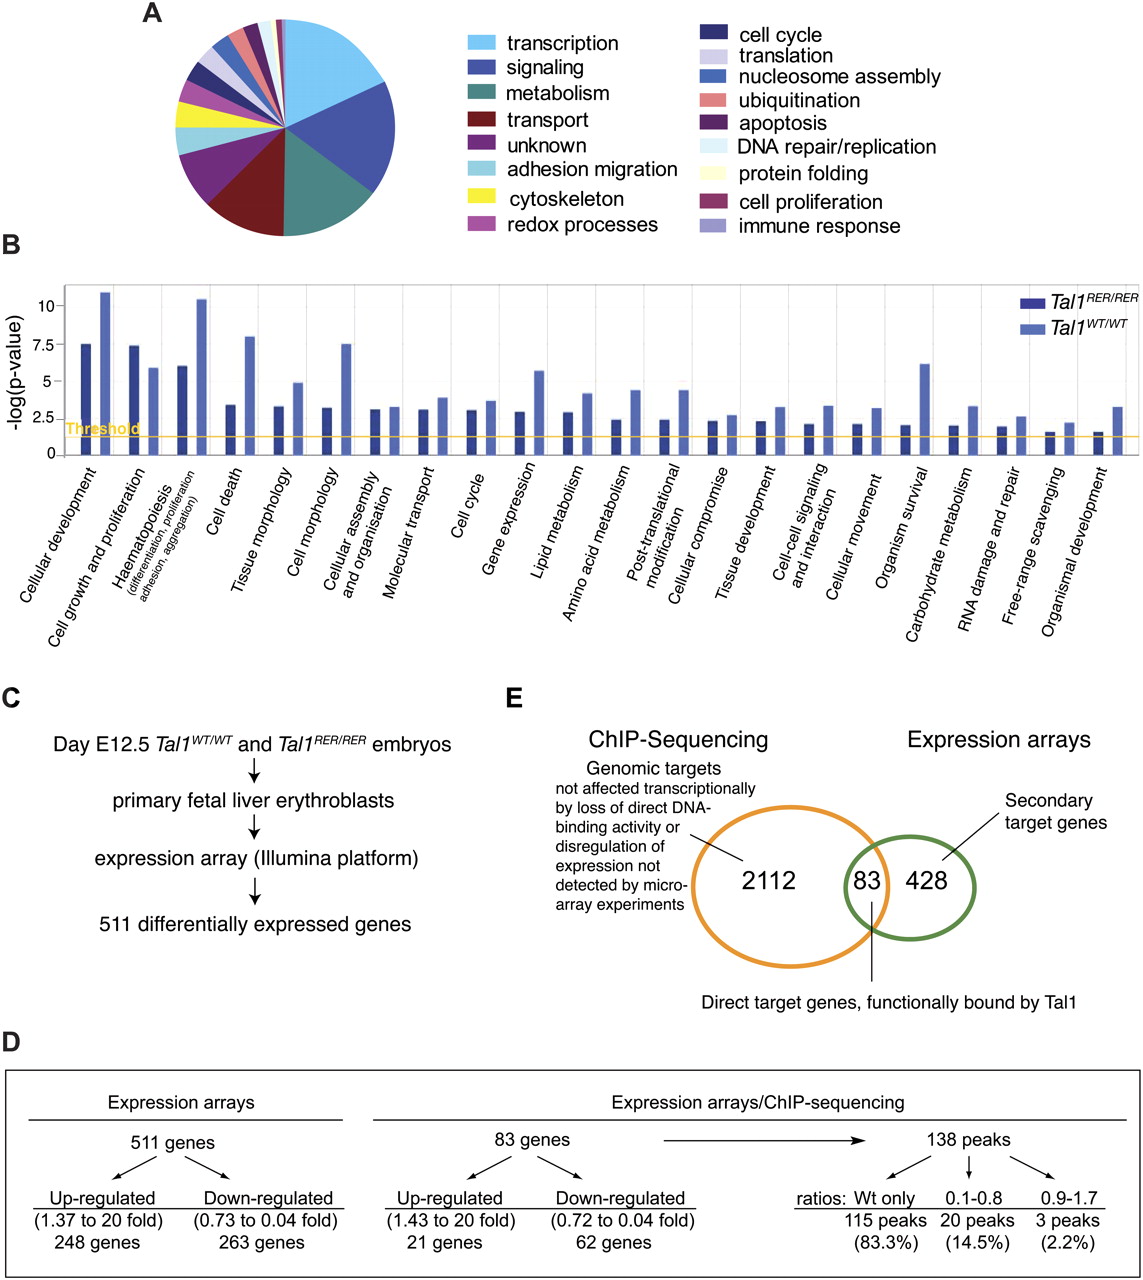
Combining ChIP-seq data with gene expression analyses. (A) Pie chart showing the distribution of the genes identified as candidate targets of TAL1 in Tal1WT/WT fetal liver cells according to their GO. (B) Highly enriched functional categories (1.1 × 10⁻¹¹ < P-values < 0.05) were identified in the gene sets characterized from Tal1WT/WT and Tal1RER/RER samples using Ingenuity software. The Ingenuity Knowledge Base served as background population and the Fisher's exact test was used. The threshold corresponds to a P-value of 0.05. (C) Microarray analysis: outline of the experimental strategy. (D) Characteristics of genes revealed by expression arrays (511) and those identified in the intersection with ChIP-seq data (83). See text for details. (E) Venn diagram showing the overlap between the genes detected by ChIP-seq and those revealed by expression array.


