
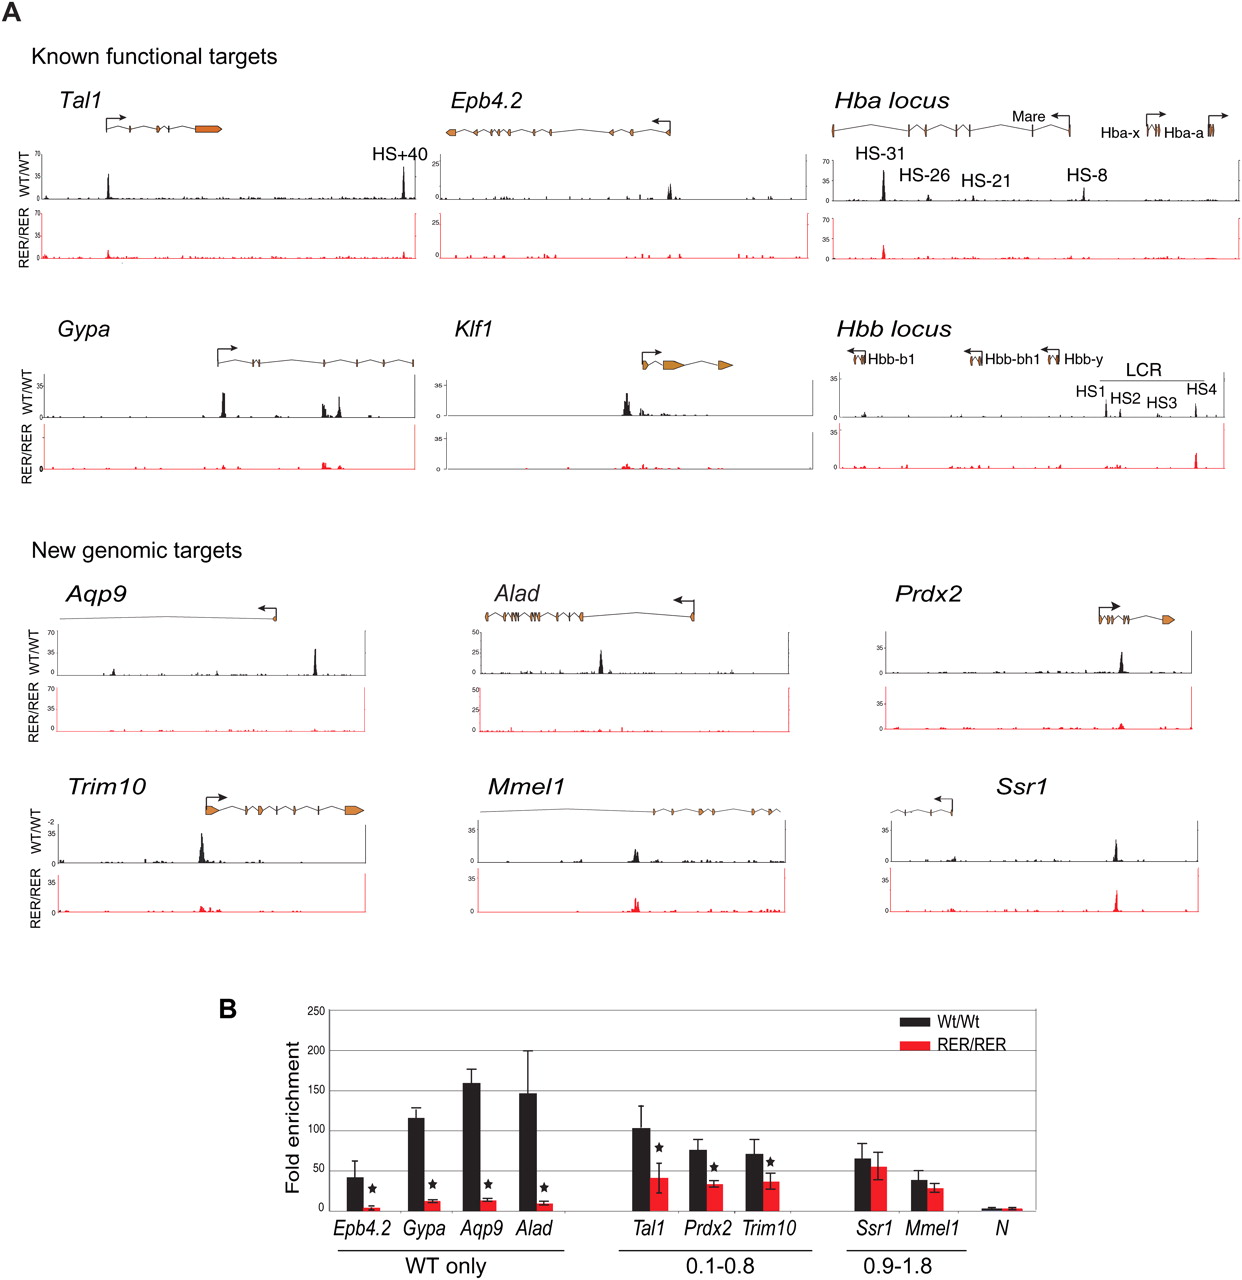
Profile of TAL1 binding on chosen loci. (A) Selected known functional or novel genomic targets of TAL1 are represented. For each locus are shown (from top to bottom): the RefSeq annotation of the gene or part of the gene (orange, exons; thin lines, introns; arrow, position of the TSS); the ChIP-seq profiles in Ter119- populations from Tal1WT/WT (black tracks) and Tal1RER/RER (red tracks) fetal liver cells. (B) Real-time PCR analysis of anti-TAL1 ChIP on selected loci. Chromatin derived from Ter119- populations from Tal1WT/WT and Tal1RER/RER fetal liver culture cells was immunoprecipitated using anti-TAL1 antibodies and the loci indicated on the graph analyzed by real-time PCR. The y-axis represents the enrichment over input DNA, normalized to a control sequence in the Gapdh gene. N, negative control. Error bars, ±1 SD, from at least three independent experiments (*P < 0.01). Below the graph are shown the categories the peaks belong to, as detected by ChIP-seq.


