
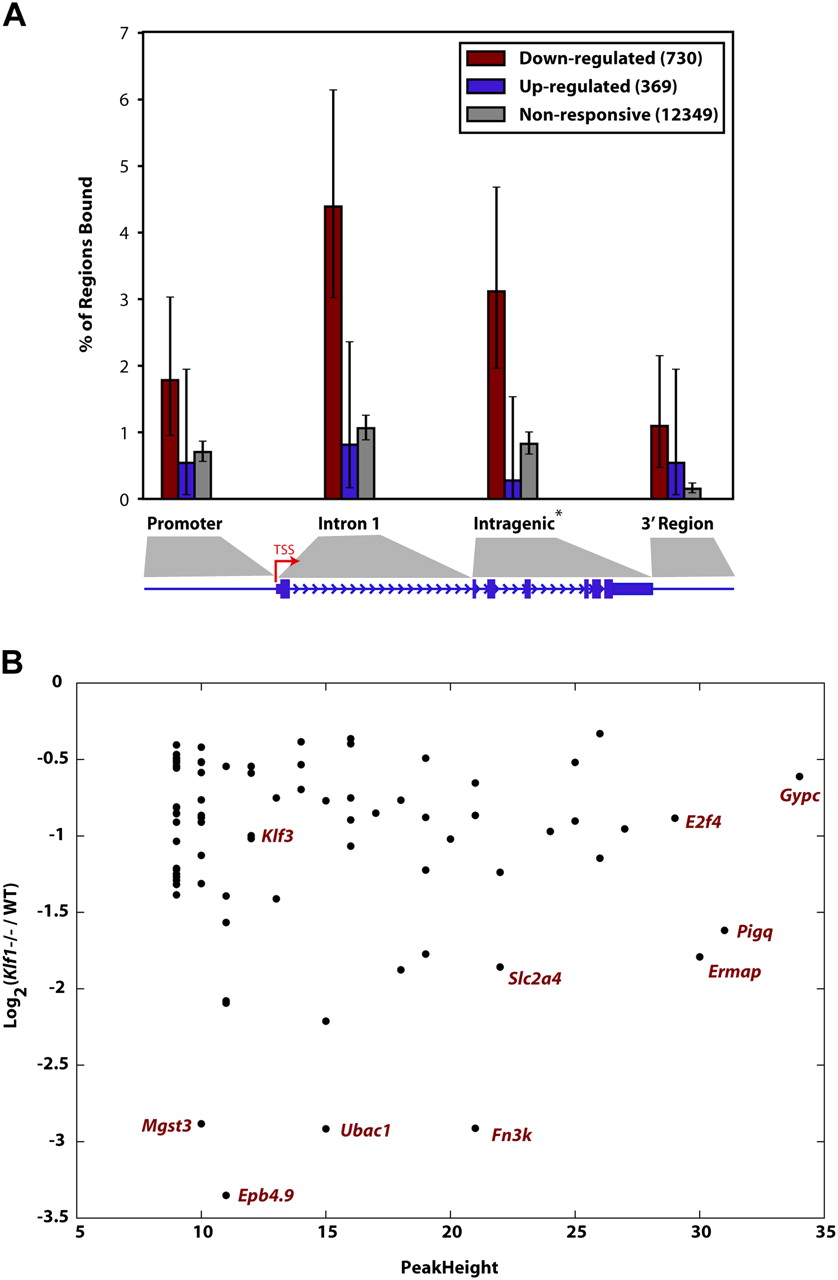
KLF1 acts primarily as a direct activator of target genes and not exclusively via promoter regions. (A) Each of the genes from the Hodge et al. (2006) expression profiling study were classified as “down-regulated” in Klf1−/−, “up-regulated” in Klf1−/−, or nonresponsive, when compared with WT expression. The plot shown represents the fraction of regions in the genes from each of these groups containing a KLF1 ChIP-seq peak binned into categories as shown in the cartoon underneath where the size of the promoter and 3′ region are each 2 kb. Each error bar represents the 95% confidence interval for the given fraction, assuming the number of regions with a peak follows a binomial distribution with N equal to the number of regions of that class. Note genes consisting of a single exon do not contribute to the intragenic region calculation. (B) A plot describing the relationship between fold change in expression in Klf1−/− fetal liver compared with WT for genes that are “bound” by KLF1 within the gene or 2 kb on either side. The down-regulated in Klf1−/− fetal liver gene set is shown (i.e., genes represented by maroon bars in A). The genes represented by some of the points are shown for clarity.


