
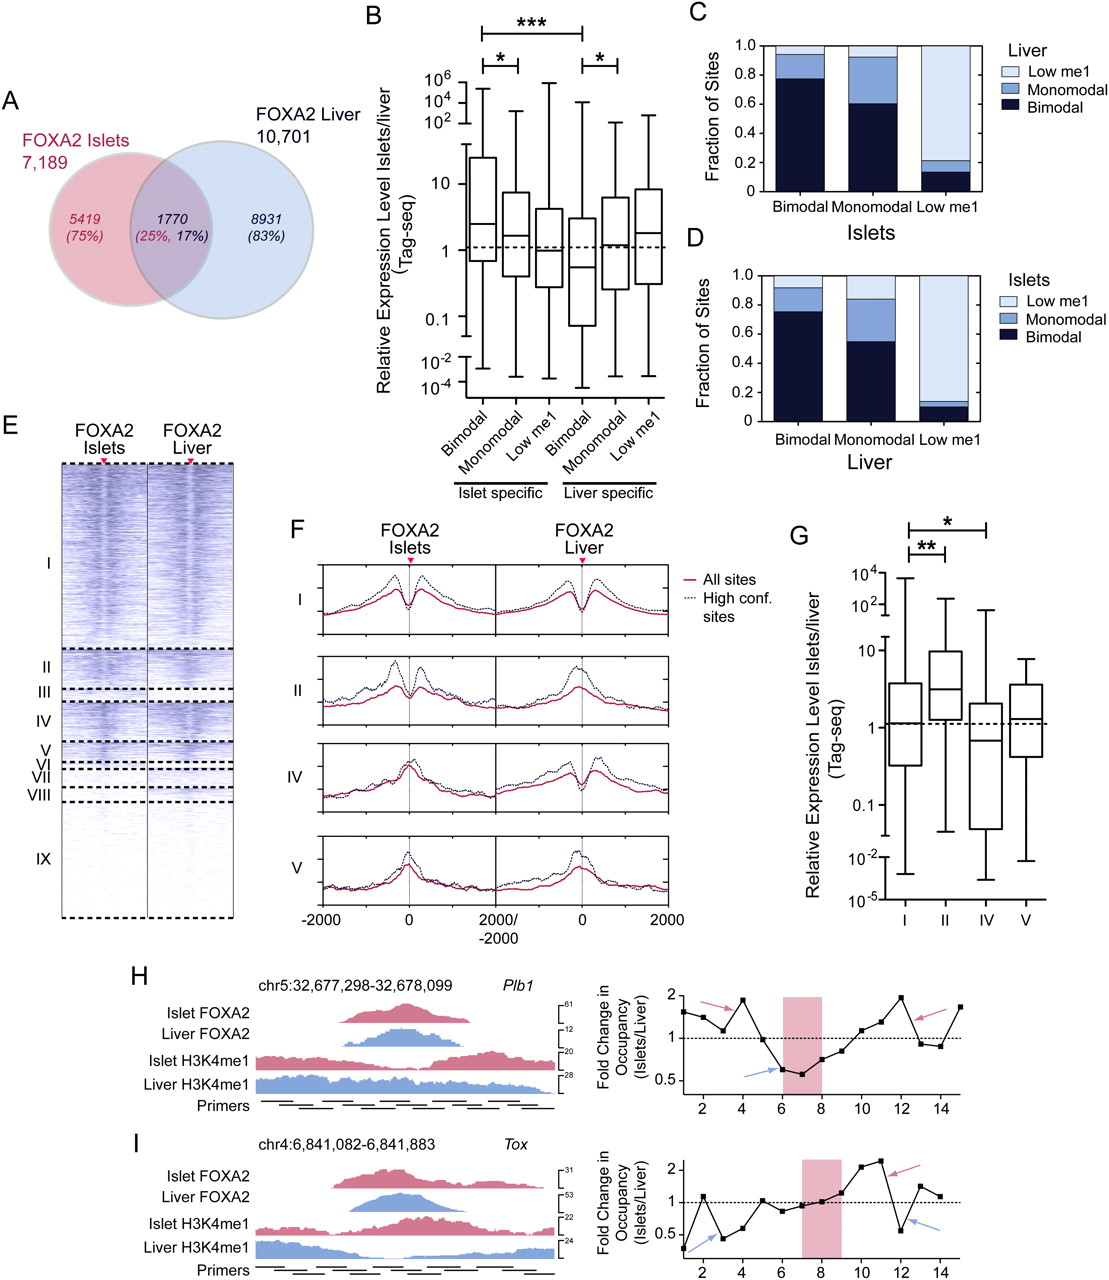
Tissue-specific FOXA2 binding and nucleosome occupancy determine tissue-specific target gene expression. (A) Venn diagram representing the proportion of sites shared between the FOXA2 islet and liver peak sets. (B) Box-whisker plot of the relative expression level (islets/liver) of expressed genes with associated islet- or liver-specific FOXA2 bimodal, monomodal, or low H3K4me1 sites. The fraction of FOXA2 sites shared in islets and liver that are bimodal, monomodal, or low H3K4me1 in the (C) FOXA2 islet or (D) liver peak sets. (E) A heatmap of H3K4me1 profiles in islets and liver for shared FOXA2 sites. Sites in group I are bimodal in both tissues; group II sites are bimodal in islet and monomodal in liver; groups III and VI–IX sites have low H3K4me1 (i.e., below the profile's global FDR threshold); group IV sites are islet monomodal and liver bimodal; and group V sites are islet and liver monomodal. (F) Profiles of average H3K4me1 read density for the shared site groups. Solid red lines are the average red densities for all peaks in a category, while dotted lines represent data from the high-confidence subset. (G) Box-whisker plot of the relative expression level (islets/liver) of expressed genes associated with peaks in groups I, II, IV, and V. Nucleosome mapping by MNase-qPCR confirms that nucleosome occupancy at transcription factor loci is altered at loci that are bimodal in islets and monomodal in liver (H), and vice versa (I). (Left) ChIP-seq enrichment profiles of the assessed loci, with the locations of the primers used for MNase-qPCR. (Right) Fold changes in nucleosome enrichment in islets/liver, calculated from MNase-qPCR results. Red arrows indicate regions that were specifically enriched for nucleosomes in islets, while blue arrows indicate regions that were specifically enriched for nucleosomes in liver. The red-highlighted regions indicate the primer pairs flanking identified FOXA2 binding motif locations and represent the relative location of FOXA2 binding. In B and G differences in expression were assessed using a Kruskall-Wallace non-parametric test with a Dunn's comparison. (*) P < 0.05; (***) P < 0.001.


