
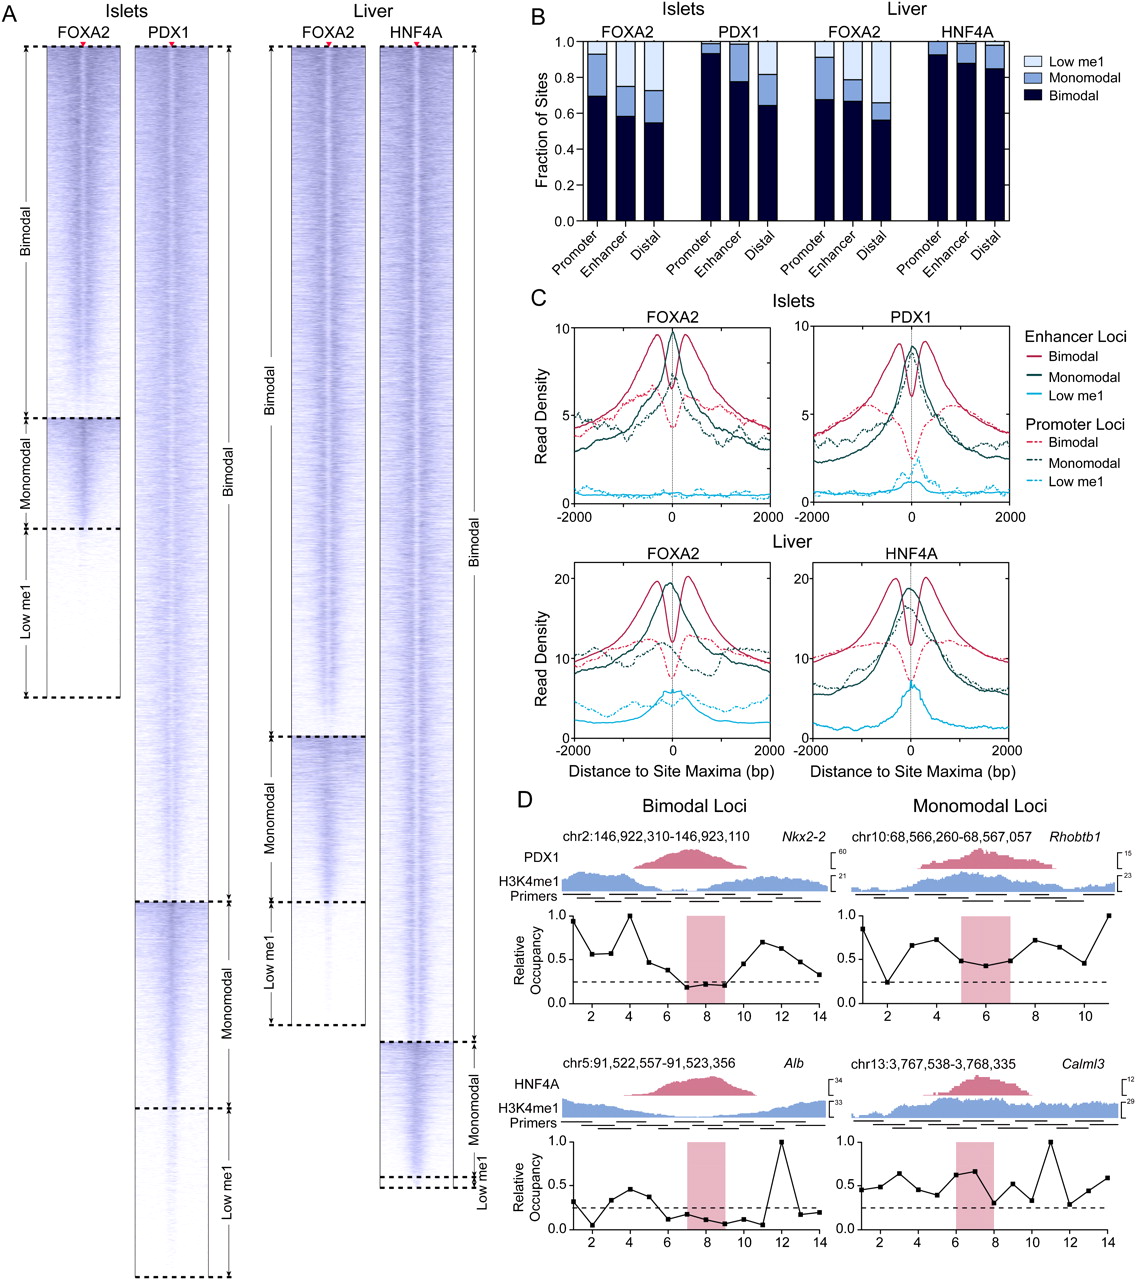
H3K4me1 profiles segregate discrete classes of transcription factor occupied loci. (A) Heatmaps of H3K4me1 read density in ±2-kb regions centered on FOXA2 (islets or liver), PDX1, and HNF4A peak maxima. Peak max locations are indicated by red triangles, with flanking H3K4me1 read density plotted horizontally in blue for each site. H3K4me1 read density is represented by the intensity of blue in the heatmaps: (dark blue) high; (light blue) low read density; (white) minimal or no H3K4me1. (B) Fractions of bimodal, monomodal, or low H3K4me1 promoter, enhancer, or distal (>50 kb from any RefSeq TSS) loci in each library. (C) Mean H3K4me1 enrichment profiles associated with promoter and enhancer loci in each site class in the FOXA2 (islets or liver), PDX1, and HNF4A peak sets. Peak maxima are centered at 0. (D) Nucleosome mapping by MNase-qPCR confirms the presence of nucleosomes. (Left) Flanking selected bimodal sites; (right) immediately at or adjacent to transcription factors binding locations at monomodal sites. UCSC Genome Browser screenshots of representative PDX1 (top panel) and HNF4A (bottom panels) loci are shown, and the locations of the primers used in the MNase-qPCR are indicated. The panels beneath the browser screenshots show MNase-qPCR results, with regions of relative enrichment indicative of nucleosome positions. The red-highlighted regions indicate the primer pairs flanking identified motif locations and represent the location of transcription factor binding; the dashed lines, at a relative occupancy of 0.25, are shown as a reference.


