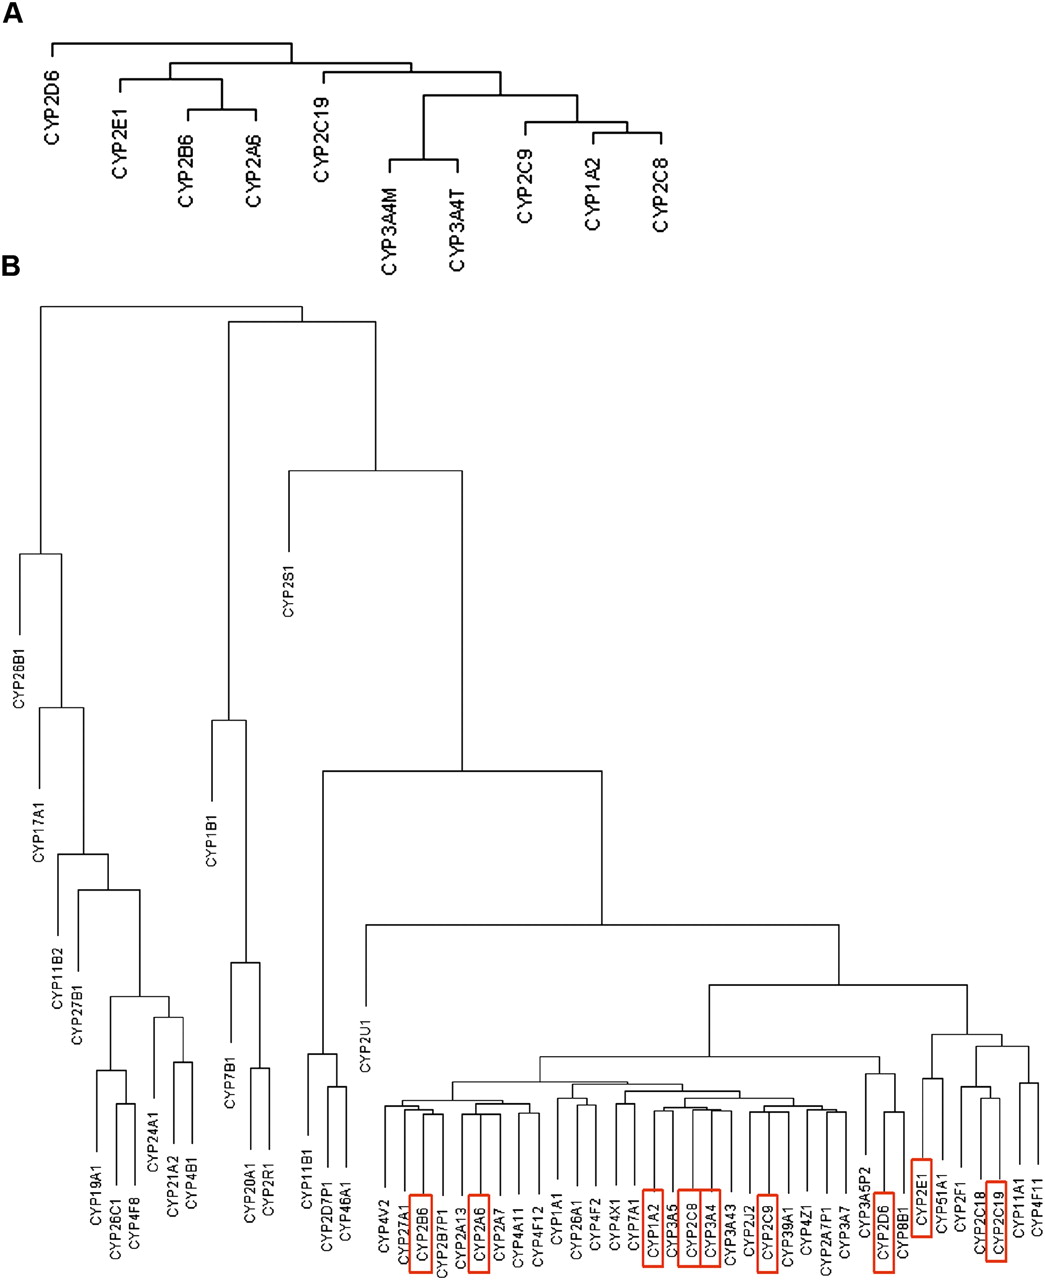
Systematic genetic and genomic analysis of cytochrome P450 enzyme activities in human liver

(Downloading may take up to 30 seconds. If the slide opens in your browser, select File -> Save As to save it.)

Click on image to view larger version.

Figure 2.
Figure 2.

Dendrograms of the hierarchical clustering between P450s. (A) Dendrogram of the P450 enzyme activity traits. (B) Dendrogram of the P450 gene expression traits. The coding genes for the P450 enzymes shown in A are highlighted in red rectangles in B.

This Article

  1. Genome Res. 20: 1020-1036

Preprint Server