
Figure 5.
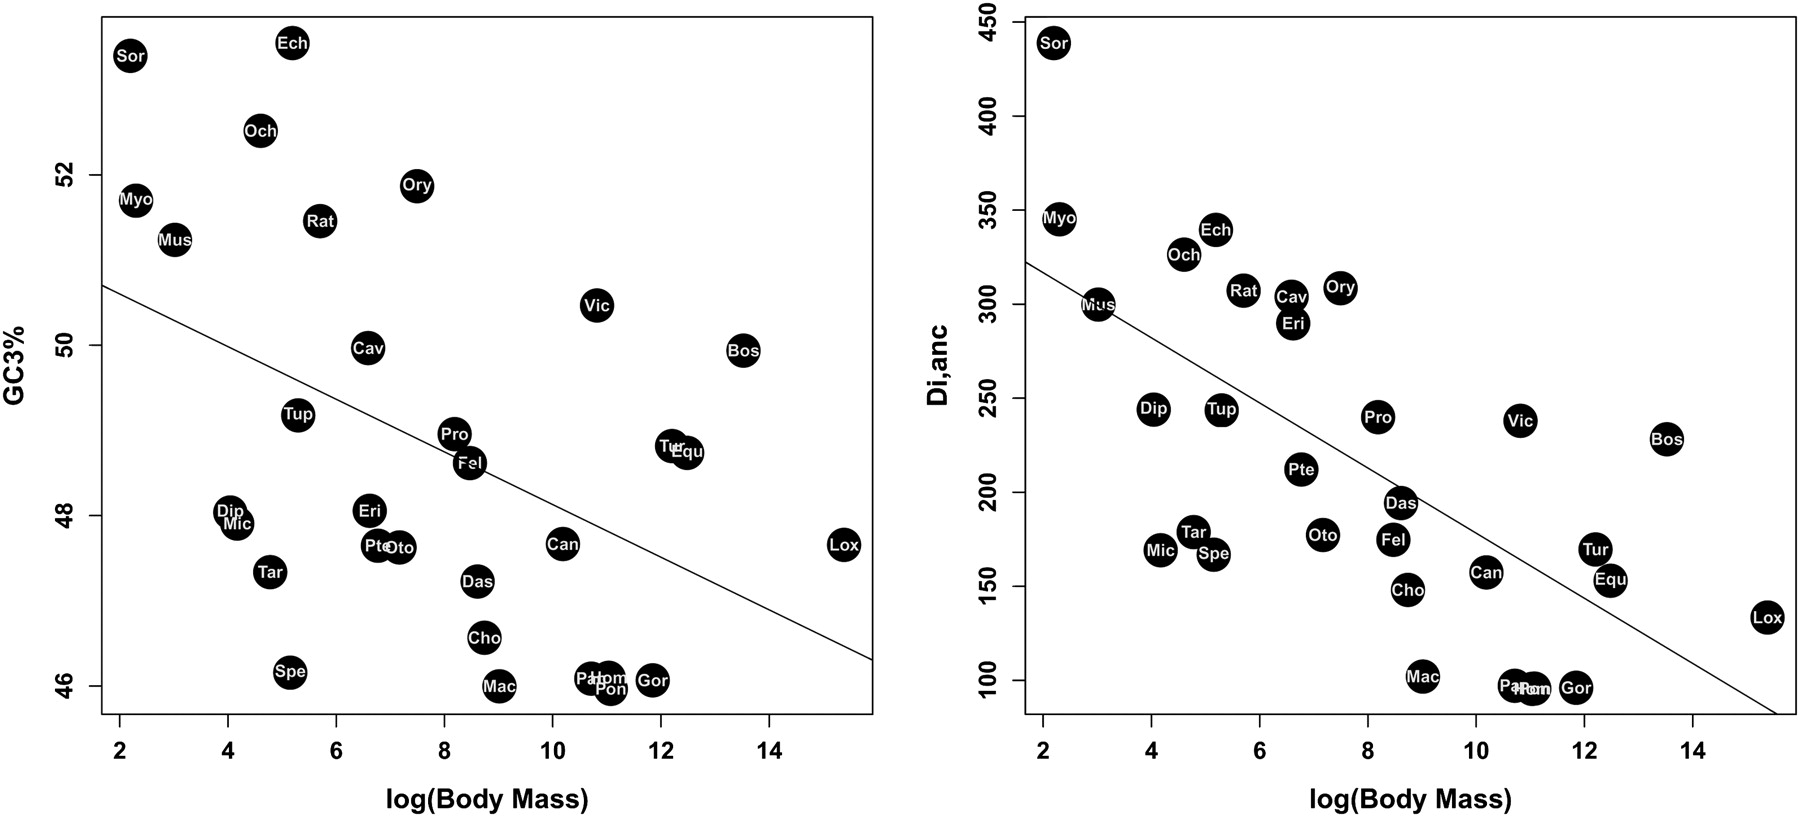
Relationship between adult body mass and GC3 (left) and Di,anc (right).
(Downloading may take up to 30 seconds. If the slide opens in your browser, select File -> Save As to save it.)
Click on image to view larger version.
Relationship between adult body mass and GC3 (left) and Di,anc (right).
 CiteULike
 Delicious
 Digg
Digg Facebook
 Google+
 Reddit
 Twitter
