
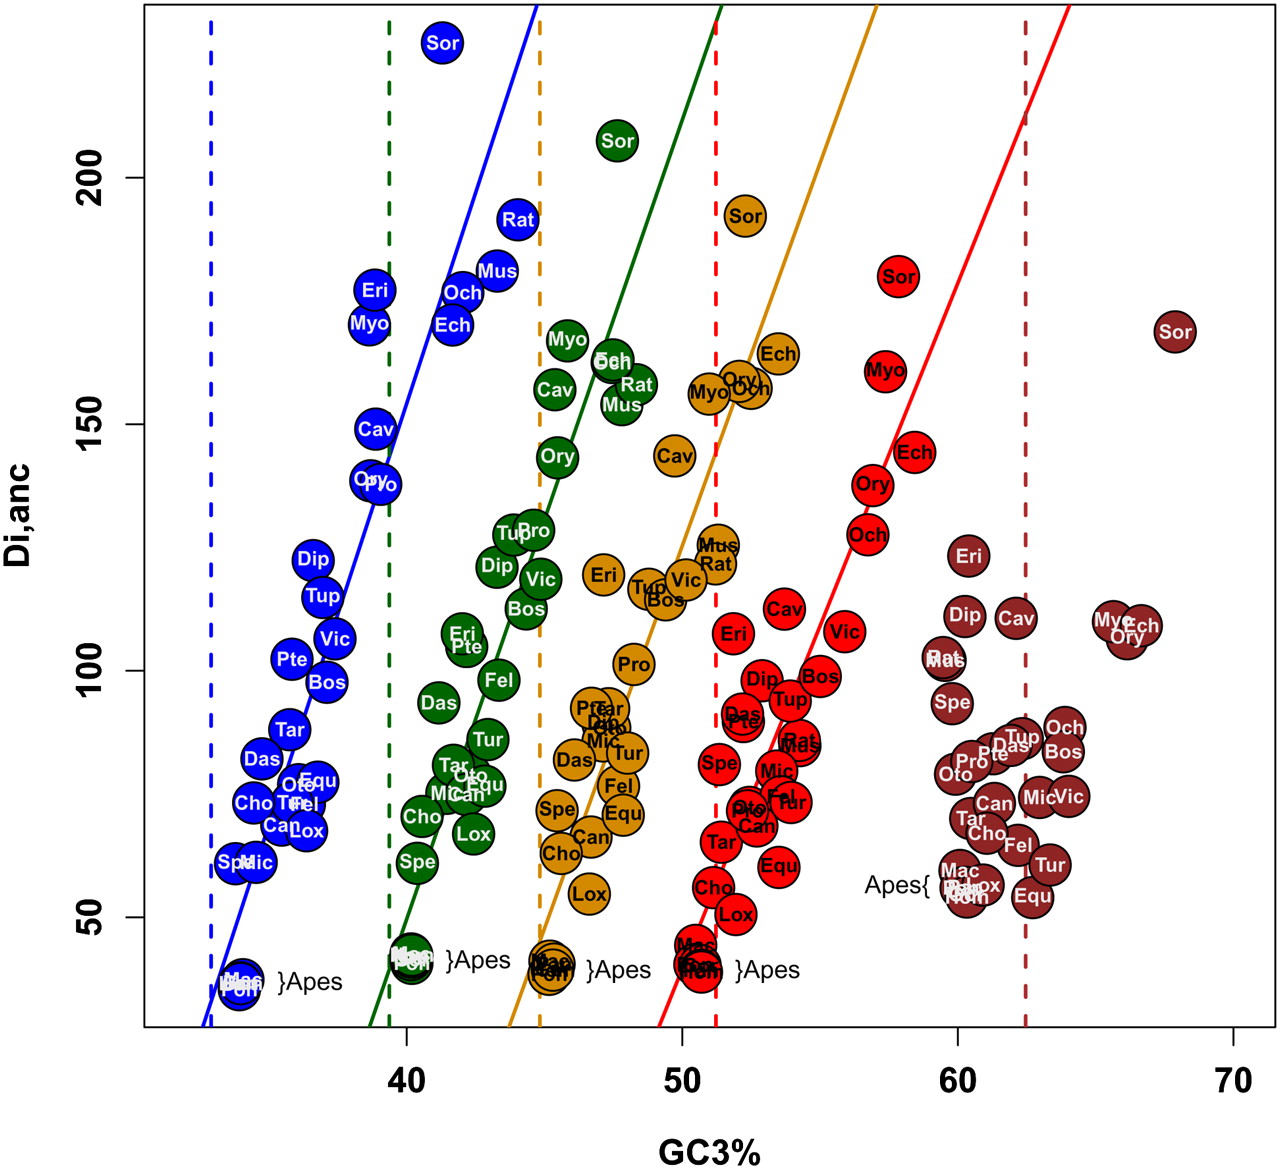
Figure 4.
GC3 dynamics in GC3-rich versus GC3-poor genes. Genes are divided into five categories, depending on their ancestral GC3%. Blue, green, orange, red, and brown are used from the least GC-rich to the most GC-rich categories. Within each category, the average GC3 of each placental species is plotted against Di,anc (i.e., the average amount of GC3 divergence among the 1138 genes since the placental ancestor). Dotted lines represent the average ancestral GC3 within each category.


