
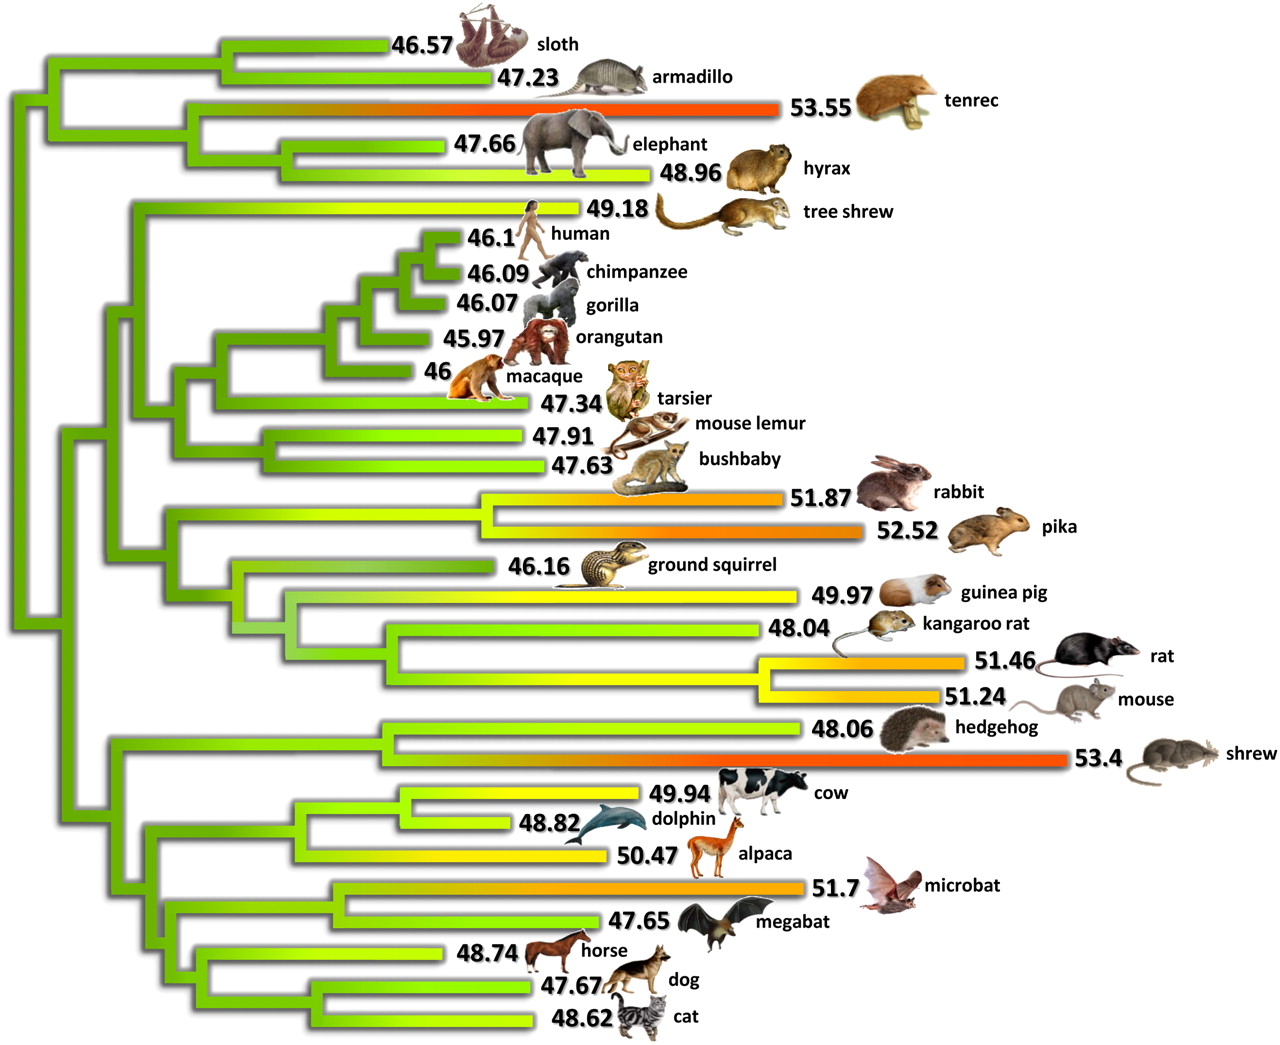
Figure 1.
Genomic third-codon position GC-content (GC3) evolution in placental mammals. Colors reflect current or estimated average GC3 on 1138 orthologous genes (green, low GC; yellow, medium GC; red, high GC). current or estimated average GC3 on 1138 orthologous genes. Branch lengths quantify the amount of GC3 divergence: the branch connecting nodes i and j has a length proportional to Di,j (Equation 2). The estimated ancestral GC content of the placental ancestor is 46.2%.


