
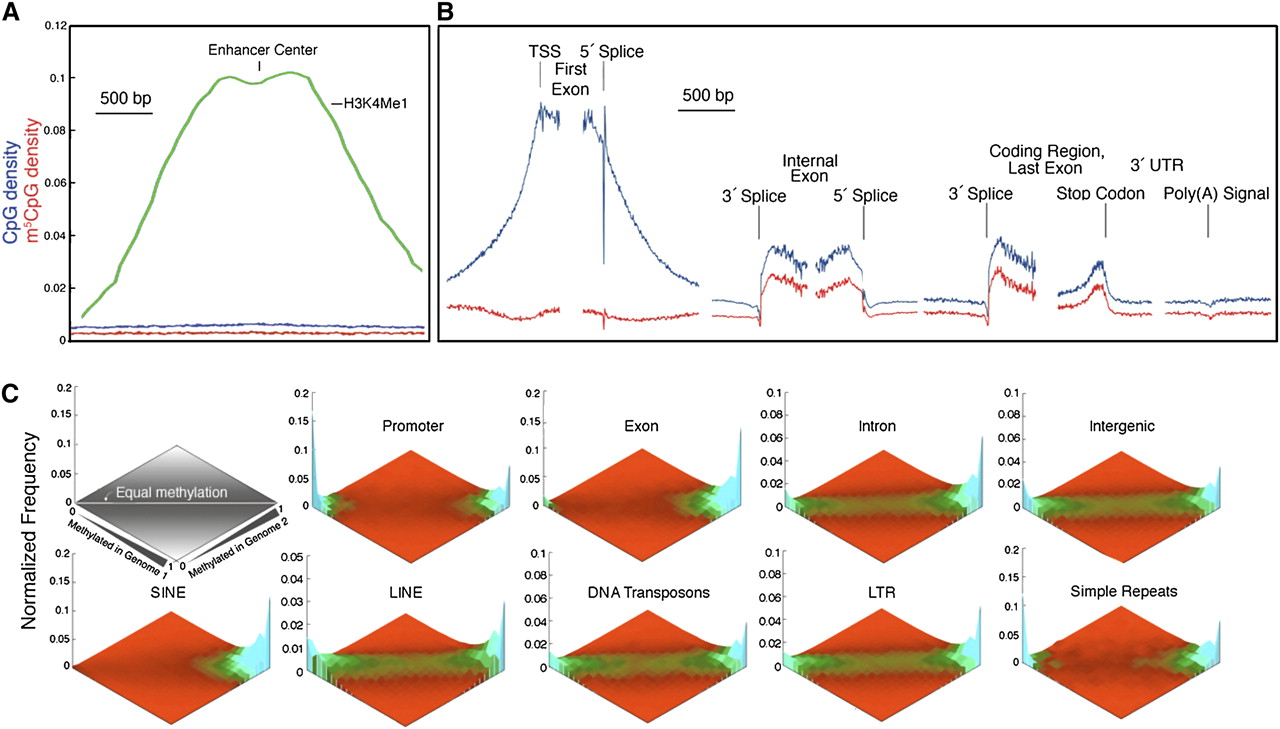
(A,B) CpG distributions and methylation patterns in human genes. m5CpG and CpG densities are shown in relation to enhancers (A), TSS, exon splice sites, stop codons, and poly(A) sites (B). Note spikes in CpG and m5CpG densities at the 5′ and 3′ ends of exons and internal to the stop codon in the last exon. (C) Comparison of methylation patterns in normal breast tissue from two individuals. Methylation status of each CpG with high coverage is computed for each sample. The frequency of such points is then plotted as a function of the methylation score for each sample. Heat map indicates frequency. Values in the left corner are unmethylated in both samples. Values in the right corner are methylated in both samples. Values along the horizontal are equivalently methylated in each sample. Some sequence classes have a wide range of methylation states, such as intronic and intergenic single-copy sequences and LINEs, LTRs, and DNA transposons. Other classes such as SINEs, exons, simple repeats, and promoters are polarized.


