
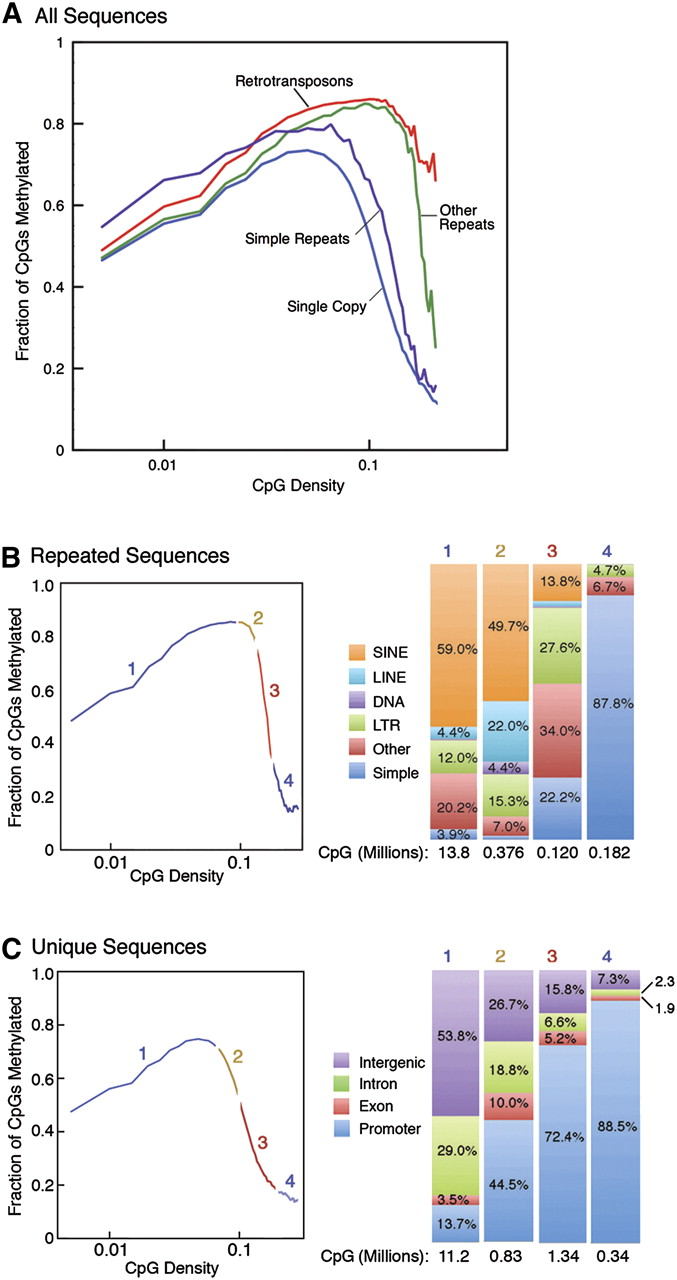
Relationship of CpG density and methylation for repeated and unique sequences. (A) CpG methylation is plotted as a function of CpG density for four distinct genomic compartments (single copy, retrotransposons, simple repeats, and other repeats). Approximately 50% of the CpGs in the genome are contained in both repeats (B) and unique sequences (C). Each curve is divided into four CpG density regions; the CpG composition of each is shown in the bar charts on the right. The large majority of CpGs are contained in region 1 in both plots (A, 96%; B, 81.9%). (B) The majority of low-CpG density CpGs are contained in SINE and LINE elements, while the highly unmethylated high-density CpGs are primarily found in simple repeats. (C) The majority of low-CpG density CpGs are contained in intergenic and intronic unique sequences, while the highly unmethylated high-density CpGs are primarily found in promoter-associated regions.


