
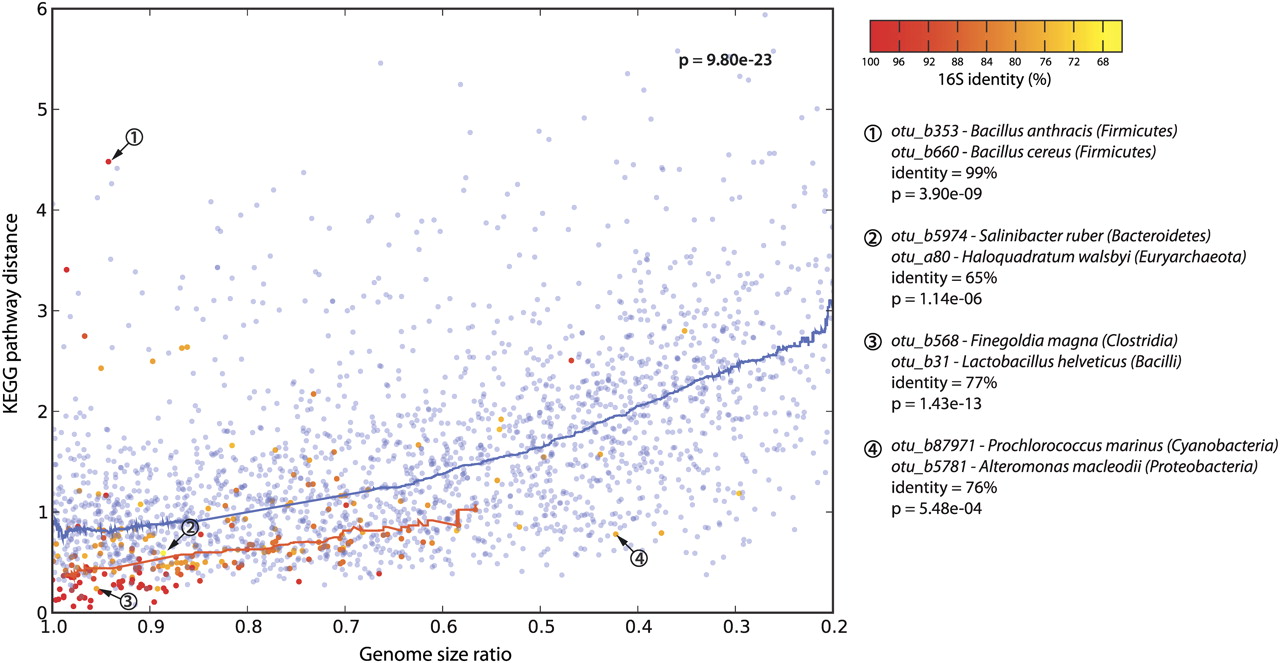
Functional similarities among co-occurring genomes. Each dot denotes a pair of genomes, which are either co-occurring in the environment (red to orange dots) or randomly paired (blue dots). The plot shows differences in functional genome content (y-axis), and in genome size (x-axis). Lines denote running medians. Note that, in general, the more divergent two genomes are in size, the more they are functionally distinct (blue line). In co-occurring genomes, this trend is strongly shifted toward similar functions, at all levels of phylogenetic relatedness (color-coded from red to orange). Examples of genome pairs that are discussed in the text are indicated.


