
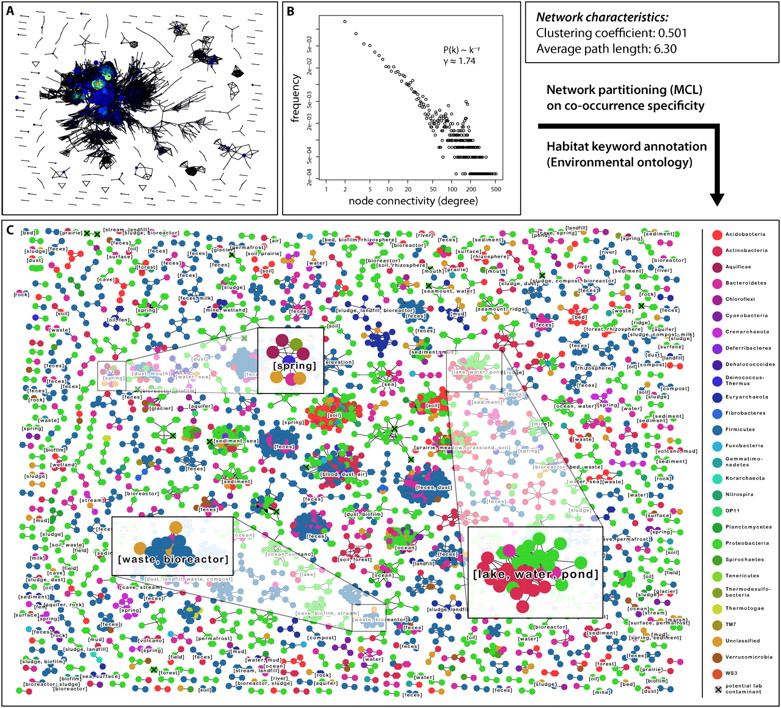
Global network of coexisting microbial lineages. (A) Overview of the network of lineage associations. Each node denotes a microbial lineage, and each line a significant co-occurrence relationship. Node size is proportional to the number of sequences in the lineage, and node color indicates the connectivity degree of a node (along a color gradient: blue, low connectivity; red, high connectivity). Throughout the figure, the OTU definition cutoff is at 97% sequence identity, and the P-value cutoff for an association is 0.001 (i.e., FDR after correction for multiple testing). (B) Connectivity degree distribution plot for the network in A. The distribution is coarsely compatible with a power law distribution. (C) Same network as in A, but partitioned using unsupervised Markov clustering, to reveal modules (clusters) of co-occurring lineages. Here, node color denotes taxonomic classification at the phylum level. Lineages suspected to contain potential laboratory contaminants (Tanner et al. 1998; Barton et al. 2006) are mainly observed in small clusters, and are marked with a small black X (17 such lineages in total).


