
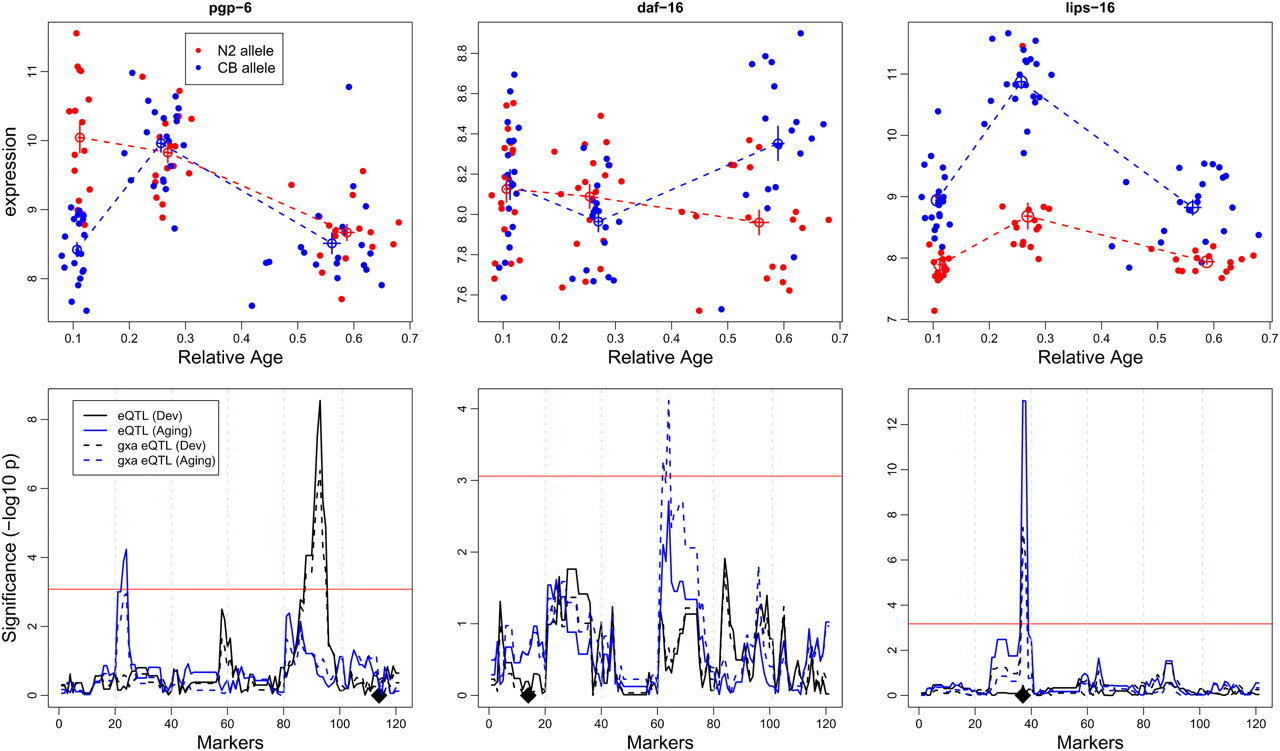
Three gene examples in which gene expression depends on age, genotype, and their interaction. (Upper panel) The relative expression (y-axis) of the N2 allele (red) and the CB4856 allele (blue) of all the RILs at the peak of the major eQTL average and standard errors. Relative age (x-axis) is the time at which the specific RIL was sampled divided by the average age of that RIL. (Lower panels) The eQTL profiles of the different factors affecting gene expression. Gene position indicated by a black diamond. (Black) The eQTL profiles obtained with juvenile/reproductive age groups; (blue) the eQTL profiles found with the reproductive/old age groups. (Solid lines) Independent (from age) genotype effects; (dashed lines) genotype-by-age interaction effects. Chromosomes are separated by vertical dotted lines. (X-axis) Marker positions: (left) chromosome I; (right) chromosome X. (Y-axis) significance level (−log10 P). (Left) pgp-6; (middle) daf-16; (right) lips-16. Thresholds are designated by the red horizontal line.


