
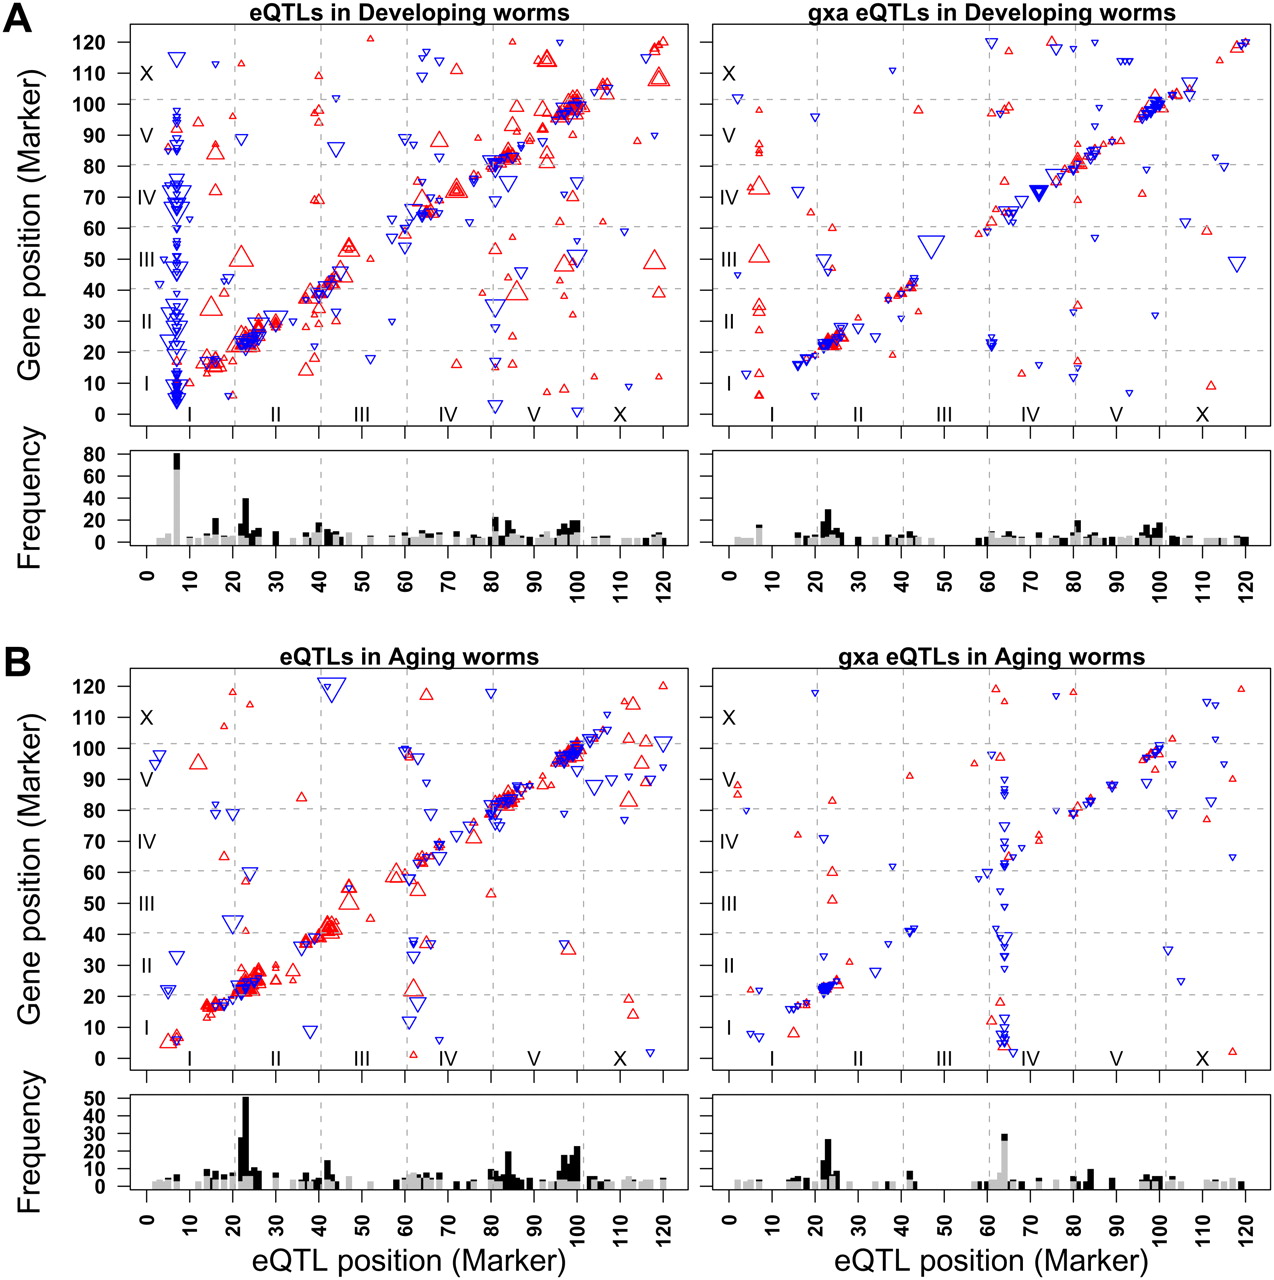
Gene position (y-axis) plotted against the marker (x-axis) of the peak of the eQTL (P ≤ 0.0001) of genotype-by-age eQTL (gxaeQTL) for that gene. The size of the triangles is relative to the significance of the positive effects of the allele; (red) N2 effect; (blue) CB4856 effect. Chromosomes are separated by the gray dashed lines. Chromosome I is located at the bottom and left of the panels, and chromosome X at the top and right of the panels. (A) Developing worms. (Left) Shows the significant (independent from age) marker (eQTLs) for the developing worms (the juvenile and reproductive worms in one model); (right) shows the significant genotype (marker) by age effects (gxaeQTL) for the developing worms (the juvenile and reproductive worms in one model). (B) Aging worms. (Left) Shows the significant (independent from age) marker (eQTLs) for the aging worms (the reproductive and old worms in one model); (right) shows the significant genotype (marker) by age effects (gxaeQTL) for the aging worms (the reproductive and old worms in one model). Two distinct trans-bands (hotspots) can be observed in the developing eQTLs (upper left) and in the aging gxaeQTLs (lower right), showing that hotspots can be found for genotype-independent eQTLs as well as genotype-by-age interaction gxaeQTLs.


