
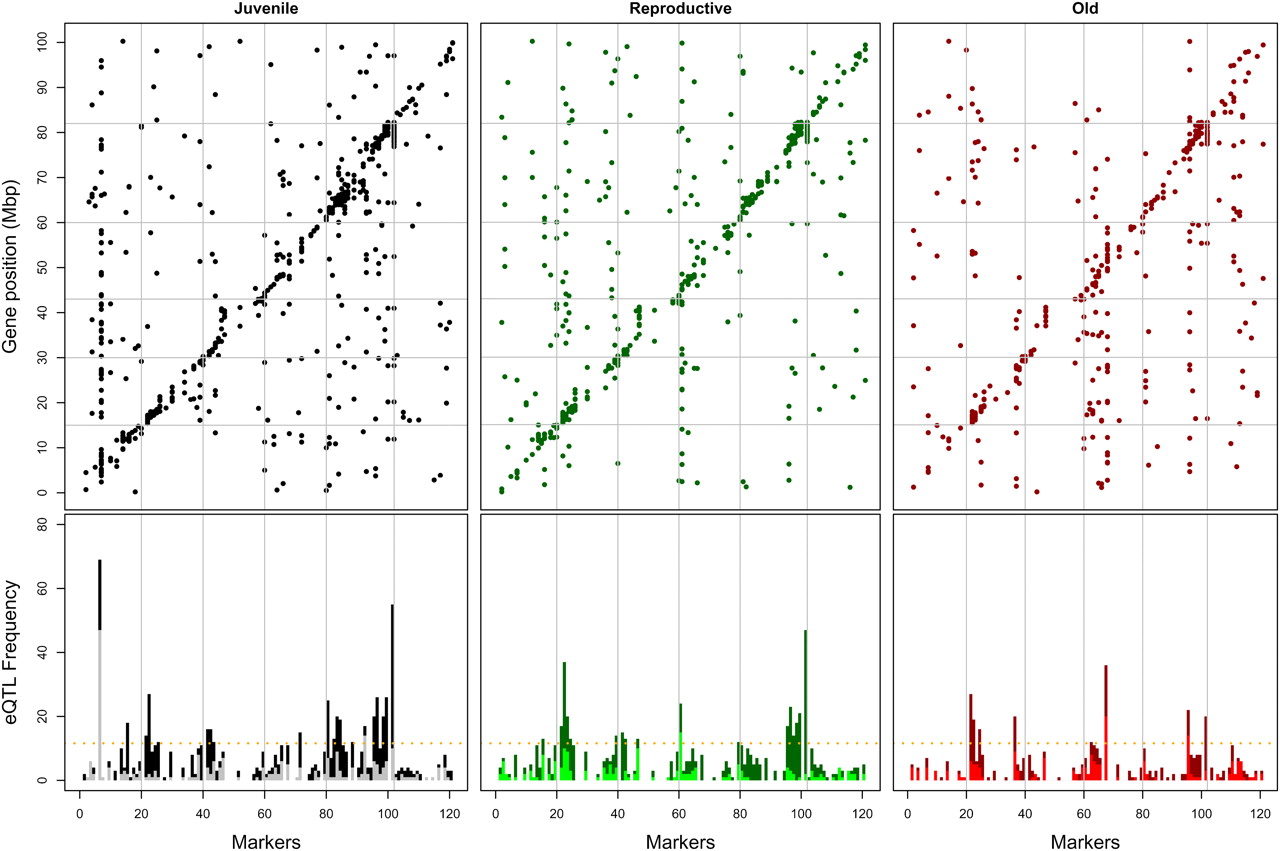
Heritable transcript-level differences at three different time points. The time points represent juvenile, reproductive and old worms. The upper graphs show the position of the genes with an eQTL (−log10 P > 3.8 ; FDR = 0.01) on the y-axis, and on the x-axis the marker at which the peak of the eQTL was found. (From left to right) Young worms in black, late reproductive worms in green, and old worms in red. The lower graphs show the distribution of eQTL per marker. The height of the bar is the total number of eQTL at that marker; cis-acting eQTLs are indicated in the darker and trans-acting in the lighter color. The constitutive and age specific hotspots can easily be identified by comparing the three panels. Any deleted genes in CB4856 were left out of the analysis. The horizontal yellow lines are the trans-band thresholds to 0.01, as determined by permutation.


