
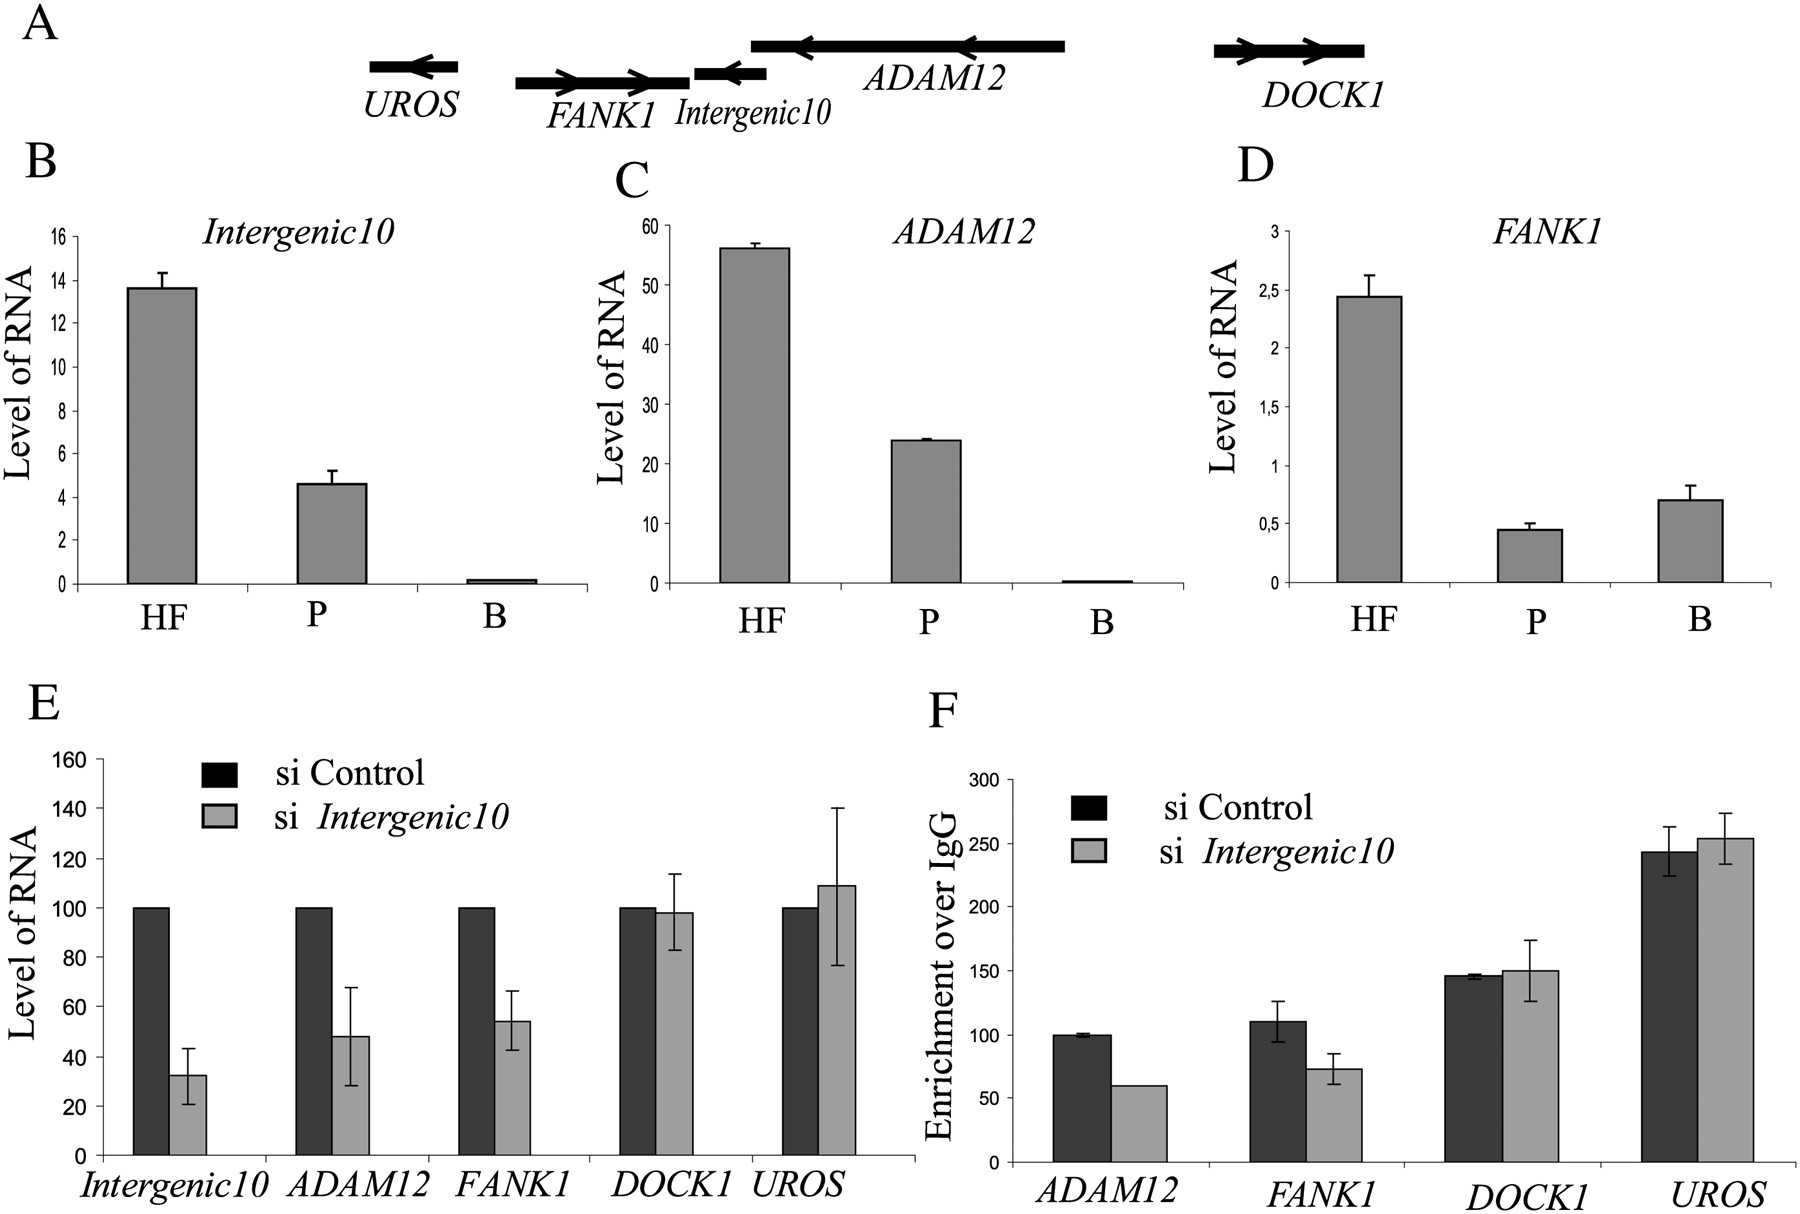
Functional validation of an intergenic CAR. (A) The chromosomal location of the Intergenic10 transcript relative to two closely located neighboring genes FANK1 and ADAM12 and distally located UROS and DOCK1 genes. The arrows indicate the direction of the transcription. The relative levels of Intergenic10 (B), ADAM12 (C), and FANK1 (D) in human fibroblast (HF), placenta (P), and brain (B), as measured by quantitative RT-PCR. (E) siRNA knockdown of the Intergenic10 RNA and its effect on the expression of the FANK1 and ADAM12 genes. Percent expression of FANK1 and ADAM12 genes in Integenic10 (gray bars) and control (black bars) siRNA-treated cells. The percentage expression in intergenic siRNA-treated cells is presented relative to control siRNA-treated cells. The distal genes UROS and DOCK1 did not show any significant down-regulation in siRNA-treated cells. RNA amounts were measured by quantitative RT-PCR from three independent experiments, and beta-actin was used for normalization. (F) The siRNA knockdown of Intergenic10 RNA in HF cells affects the active chromatin marks H3K4me2 over ADAM12 and FANK1 promoter. Levels of H3K4me2 were measured by chromatin immunoprecipitation (ChIP) in two independent experiments using antibody against HeK4me2. The enrichment of H3K4me2 was measured by qPCR using the promoter-specific primers. (Black bars) The H3K4me3 enrichment over IgG at the indicated promoters in control siRNA-treated cells; (gray bars) enrichment over IgG in Intergenic10 siRNA-treated cells. DOCK1 and UROS promoters were used as controls, showing no change in H3K4me2 marks.


