
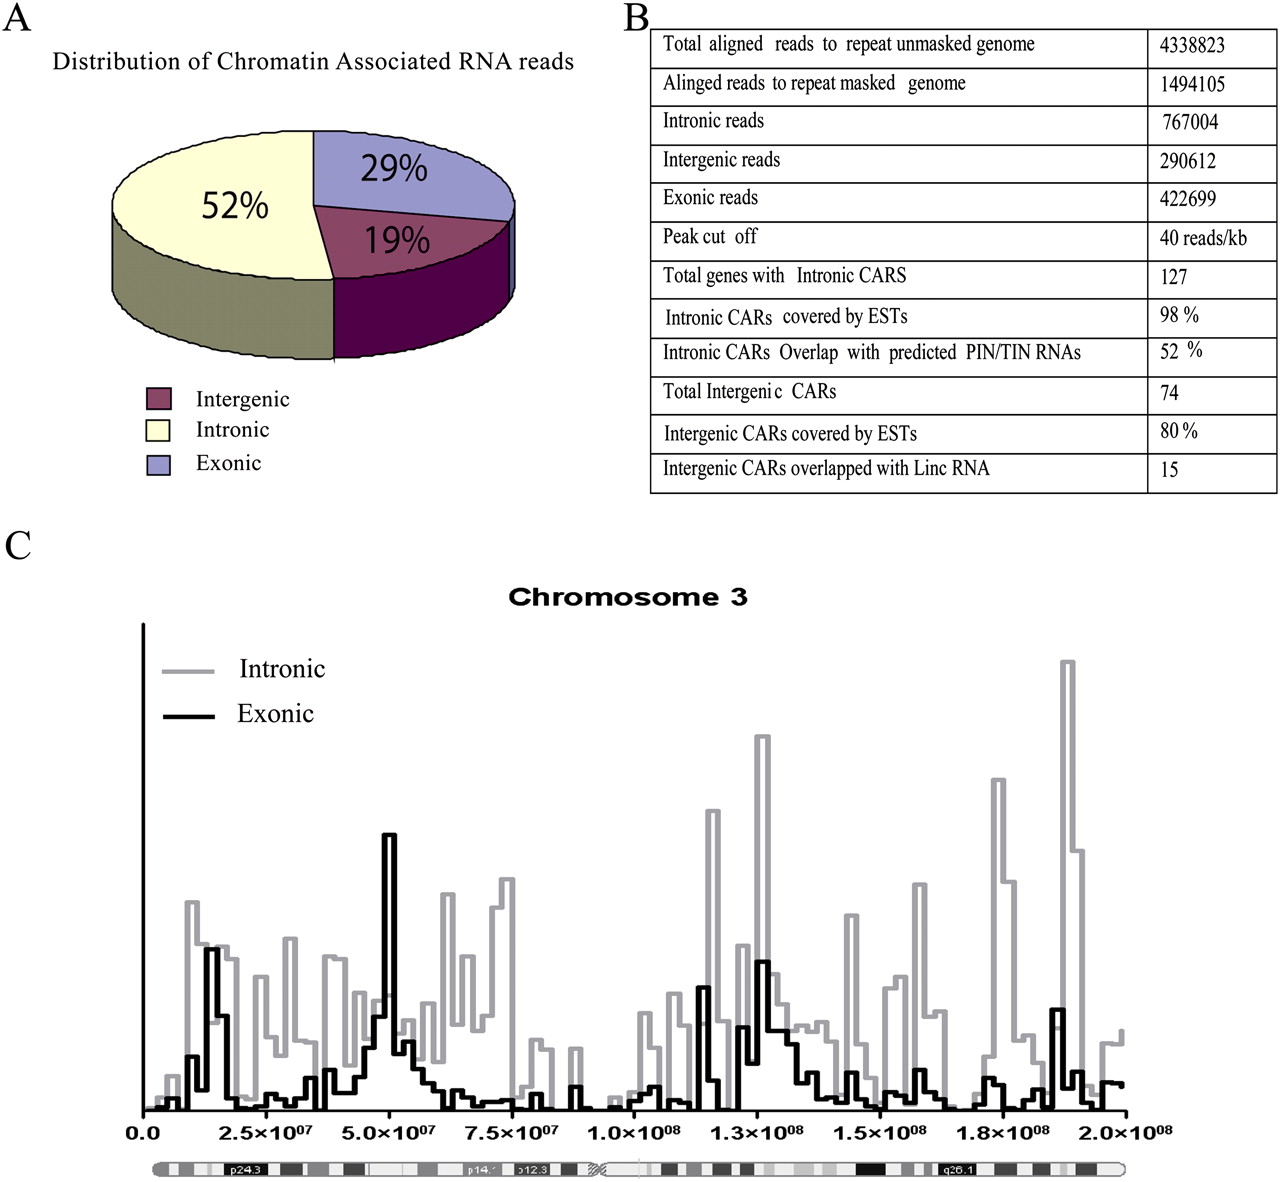
Figure 2.
Basic characterization of chromatin-associated RNA. (A) Pie chart showing distribution of the sequencing reads over intronic, intergenic, and exonic portions of the human genome. (B) The table includes information about the aligned chromatin RNA sequencing reads and the detailed analysis of the CARs. (C) Distribution of sequencing reads in the exonic and intronic regions along chromosome 3.


