
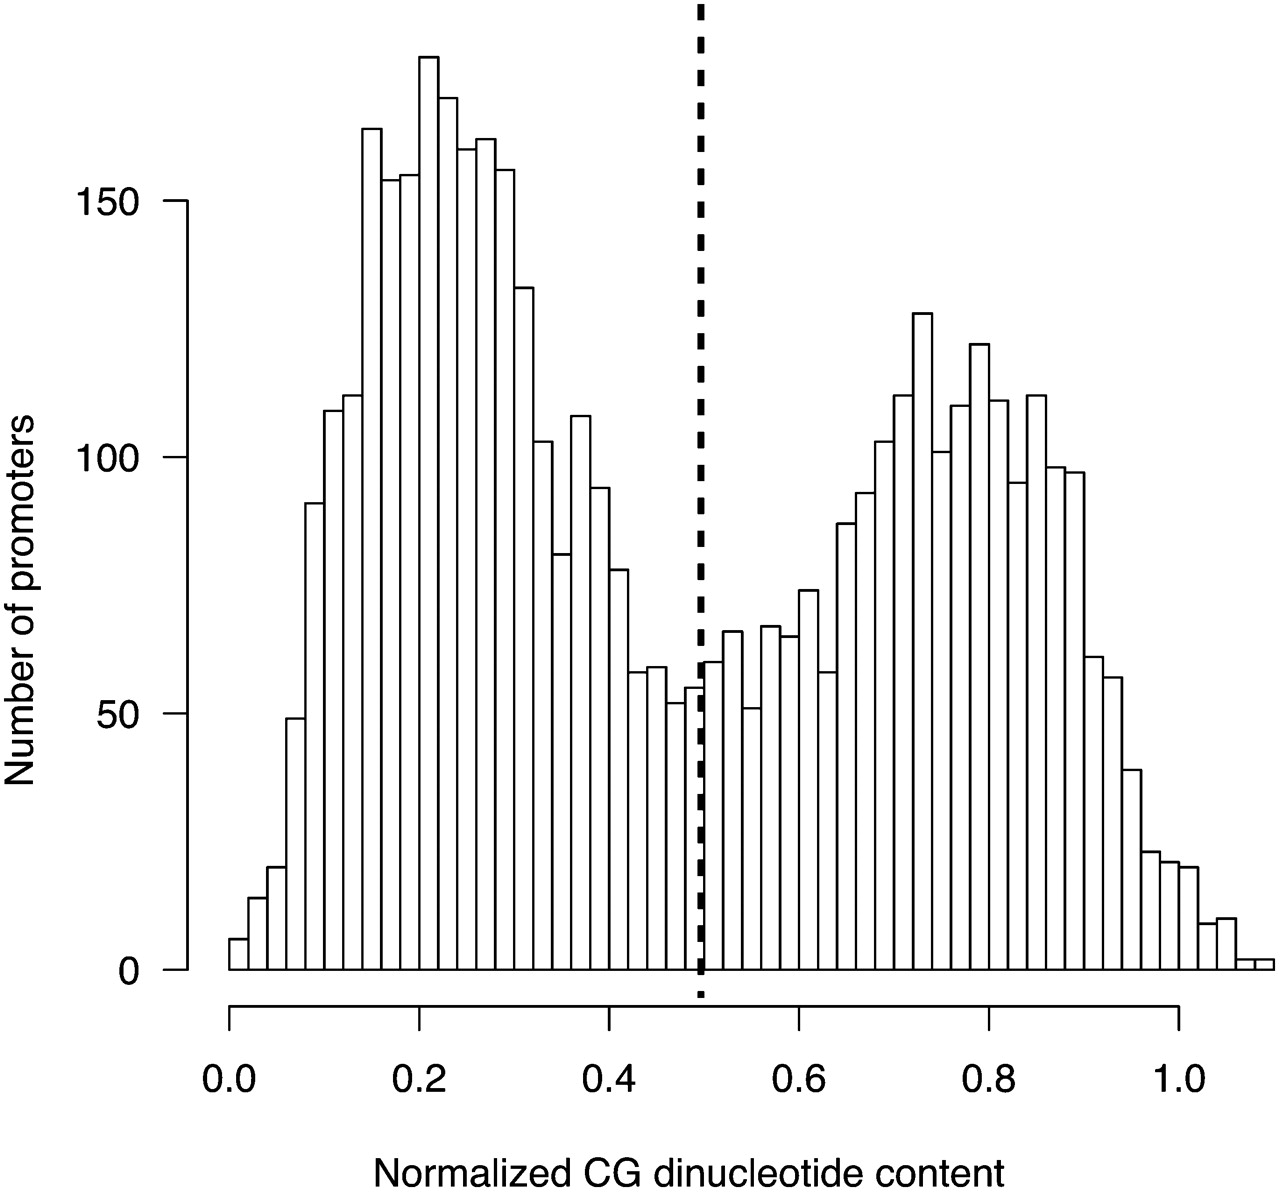
Figure 3.
Distribution of normalized CG dinucleotide content among 4575 promoters. The normalized CG dinucleotide content is defined as the ratio of observed over expected number of CG dinucleotides (see Methods). LCG promoters have normalized CG content <0.5 and HCG promoters have normalized CG content > 0.5.


