
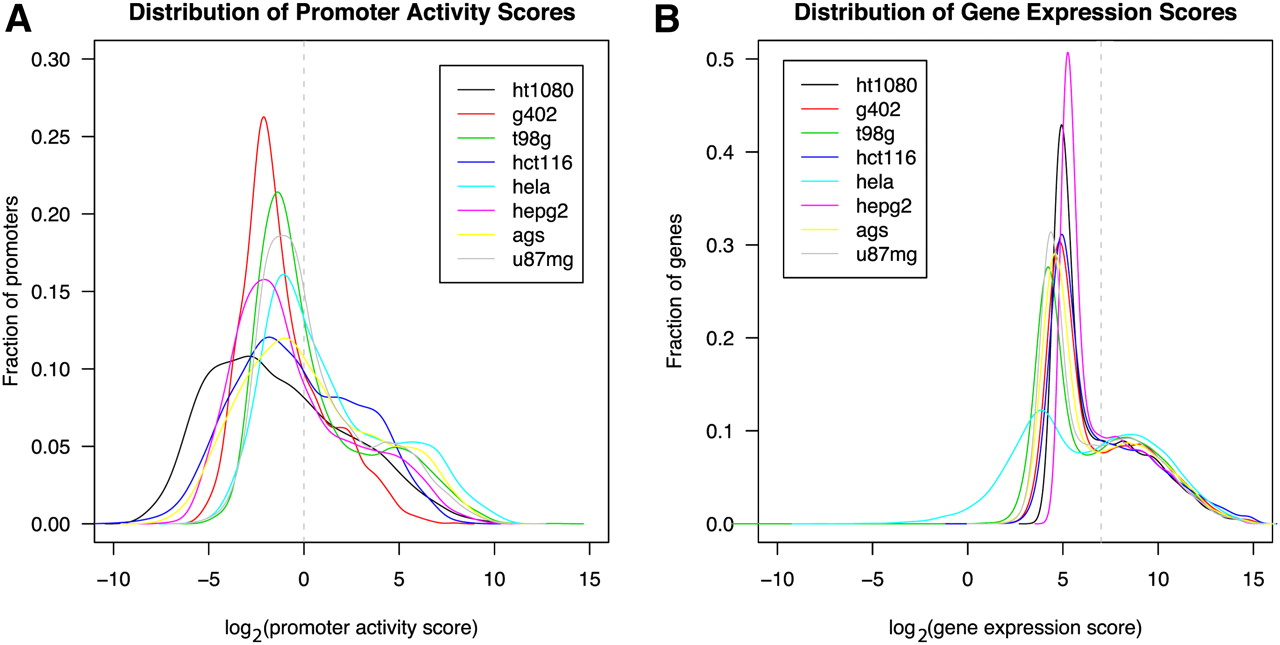
Figure 1.
Distribution of transient transfection promoter activities and endogenous gene expression scores in eight cell lines. (A) The threshold for active promoters in the transfection assay is set at log2(promoter activity score) = 0, corresponding to the point where promoter activity scores exceed the scores of negative control sequences. (B) The threshold for expressed genes is set at log2(gene expression score) = 7, corresponding to the trough of the bimodal distributions displayed in all eight cell lines.


