
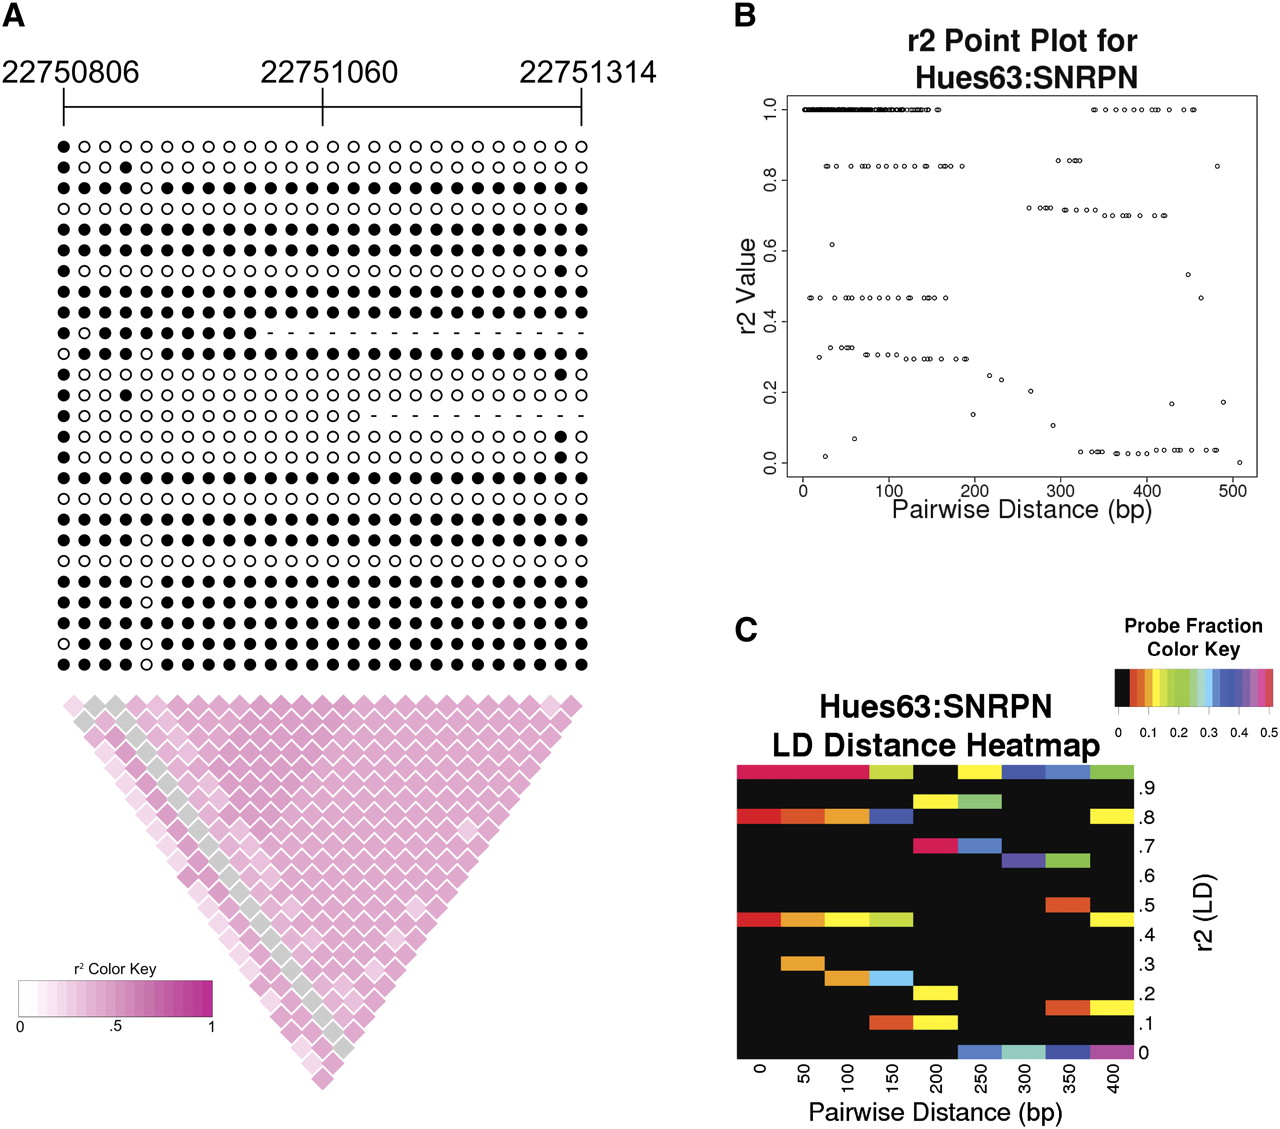
Linkage disequilibrium (LD) analysis of CpG methylation haplotypes. (A) LD diagram of 5′ region of the imprinted gene SNRPN (chr15:22750806–22751314) from Hues63. Each row represents a Sanger sequence and each column represents a CpG dinucleotide. (Filled circles) Methylated CpGs; (open circles) unmethylated CpGs, (dashed lines) methylation state of the CpG could not be determined. Chromosomal coordinates are listed above. This region shows a methylation LD block spanned over 500 bp in Sanger reads. (B,C) CpG pairwise r2-value plots and heatmap for 5′ region of the SNRPN gene. While the majority of CpG pairs have high methylation correlation values (r2 > 0.3), some pairs of CpG sites have little or no correlation (r2 < 0.3). The pairwise distance represents the separation of the CpG dinucleotides used in the r2 calculation. The heatmap colors represent the probe fraction at a given pairwise distance (rounded down to the nearest 50 bp) that has the indicated r2-value. The probe fractions for each pairwise distance sum to one. The color scale saturates at 0.5, so that small probe fraction differences can be distinguished.


