
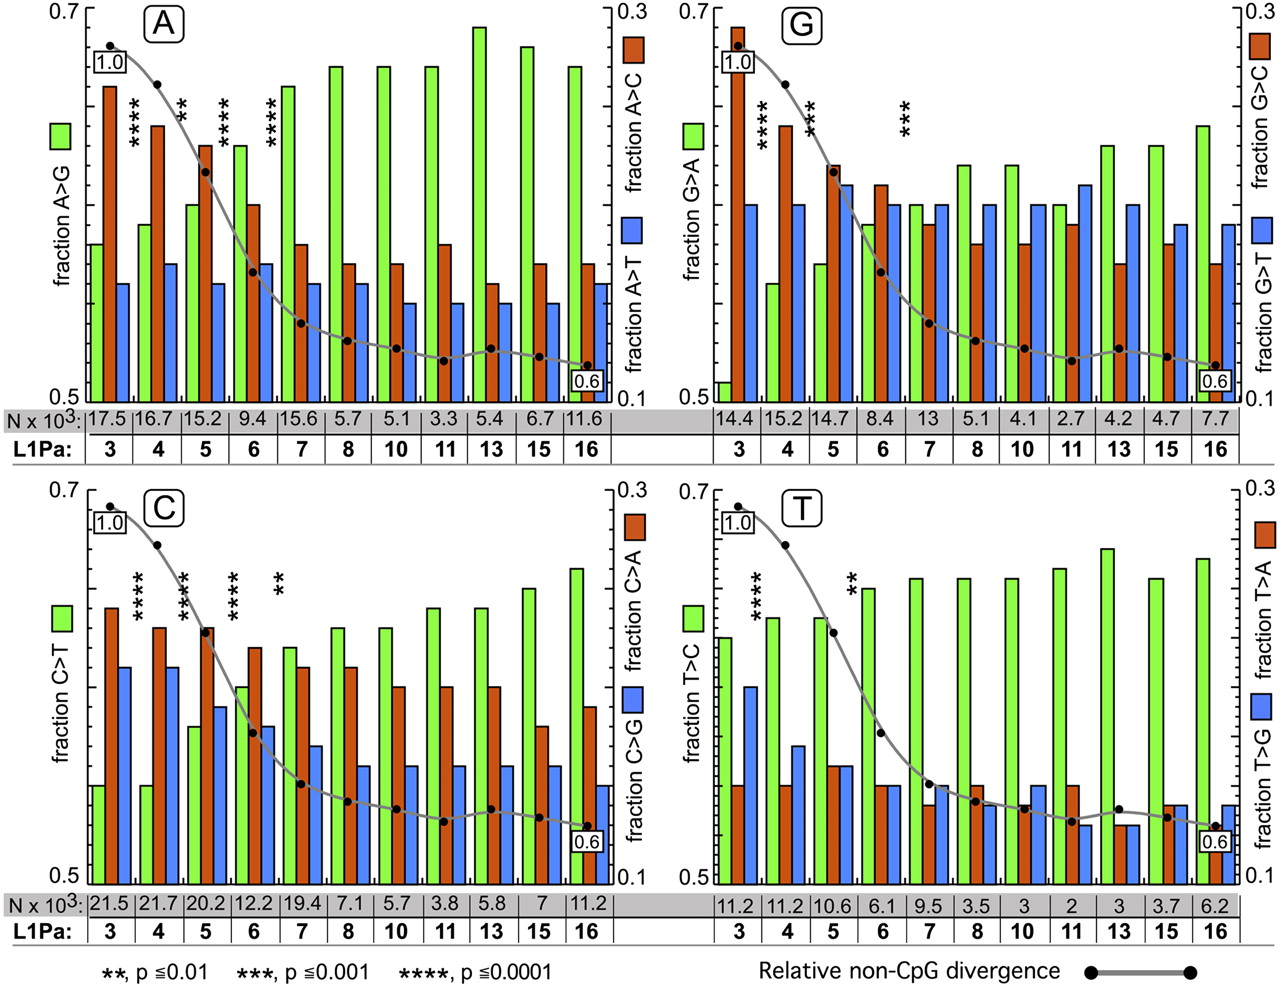
Mutational fate of each of the four bases for different L1 families. Panel A shows the distribution of A mutations to G, C, and T that occurred between the human and chimpanzee lineages for each L1Pa family. There are two x-axes on the bottom of panel A: the top one (boxed in gray) gives the total mutations (N × 103) that occurred and the bottom one (in bold) indicates the L1Pa family. For example, we found (Methods, Determination of the Mutational Spectrum) that 17,458 substitutions of A occurred between the chimpanzee and human L1Pa3 orthologs (rounded to 17.5 × 10³ in Fig. 5): 8387 and 9071, respectively, for the human and chimpanzee orthologs. Of the total, 10,095 (0.58) were G transitions (green bar, left y-axis), 4595 (0.26) were C transversions (red bar, right y-axis), and 2768 (0.16) were T transversions (blue bar, right y-axis). Note that the left (transitions) and right (transversions) axes cover different ranges. The numbers of A mutations to G, and A transversions to C or T were about the same for chimpanzee and human (results not shown). For L1Pa4, 16,678 (16.7 × 10³) A mutations occurred, again with about one-half occurring in chimpanzee and human, and again the numbers of G transitions and C or T transversions were about the same in chimpanzees and human. And so on for the rest of the families in panel A and for the mutations of G, C, and T presented in panels G, C, and T respectively. In each case the green bar (left axis) shows transitions and the red and blue bars (right axis) show transversions. The gray line is the total non-CpG divergence for each L1Pa family normalized to that of L1Pa3, set to 1.0. Families that differ in total non-CpG divergence generally differ in their proportions of transitions and transversions, especially in regard to mutations of A, G, and C (much less so for T). For example, chi-square comparisons in panel A showed that the proportion of transitions and transversions in L1Pa3 are significantly different from that of L1Pa4 (indicated by the asterisks between these families). Likewise the distribution of transitions and transversions in L1Pa4 is significantly different from that of L1Pa5, but this is not the case for proportions of transitions and transversion between L1Pa7 and L1Pa8.


