
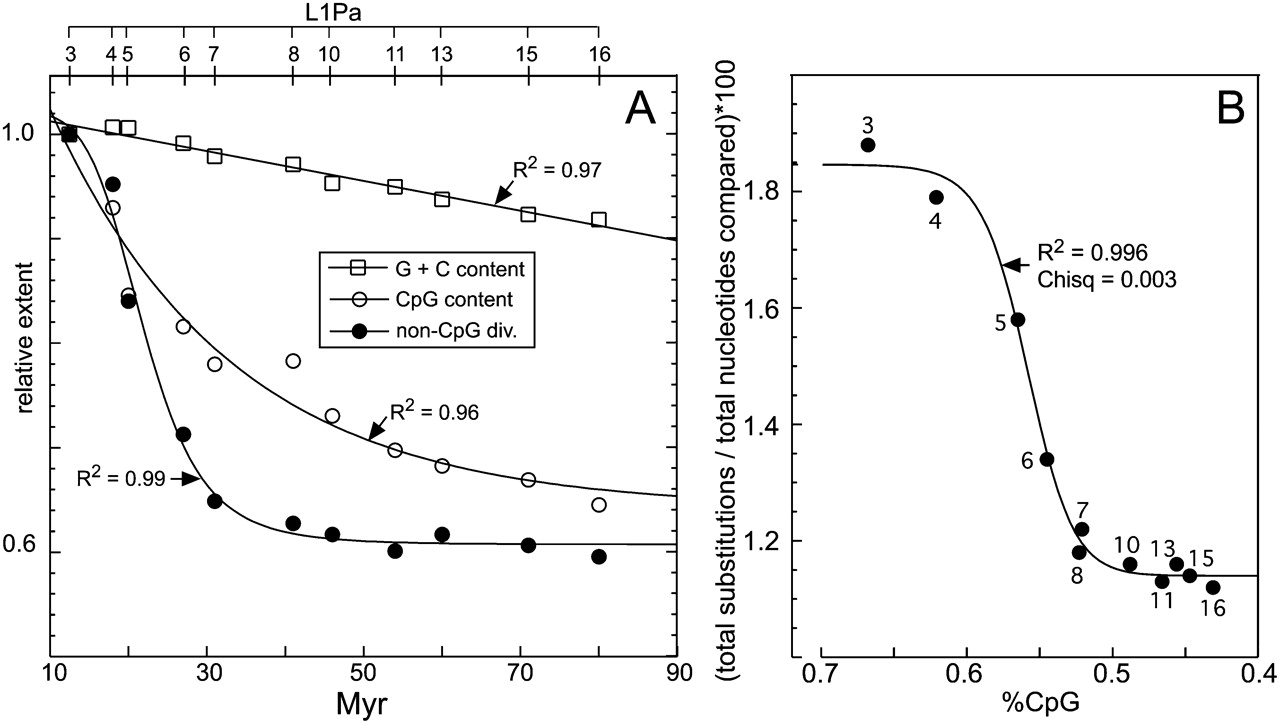
Figure 3.
CpG, G + C, and non-CpG mutations. (A) The % (G + C) and CpG contents of the various L1 orthologs and their % non-CpG mutations are normalized to those of L1Pa3 (set as 1) and plotted as a function of L1 family age. The axis at the top of the panel indicates which L1Pa families correspond to the data points in the body of the panel. (B) The % non-CpG mutations are plotted as a function of % CpG content. The non-CpG divergences fit a sigmoidal function of CpG content better than a linear function using either all or subsets of the data (see text and Supplemental Fig. S7). Numbers indicate L1Pa families.


