
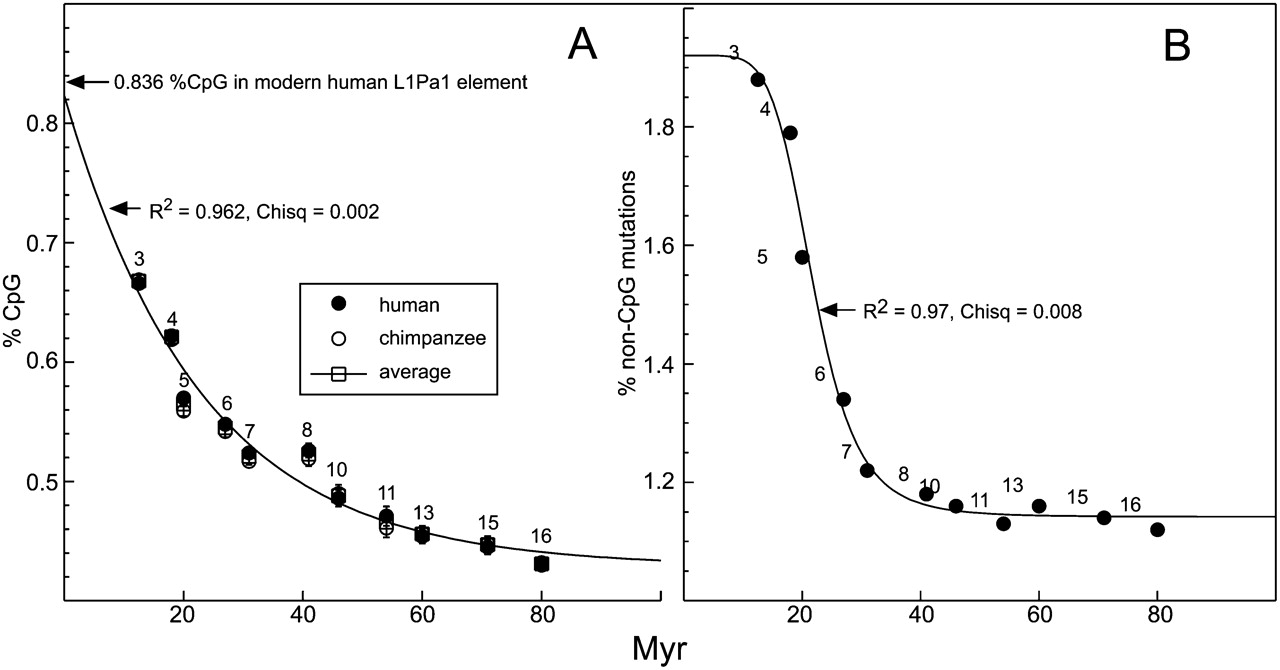
Figure 2.
Percent CpG content and non-CpG mutations as a function of L1 family age. The percent CpG content and non-CpG mutations were determined as described in the Methods. The relationship of CpG content to age is best fit by an exponential decay function (A), but that of the non-CpG mutations is best fit by a sigmoid (logistic) function (B; see text). Numbers indicate L1Pa families.


