
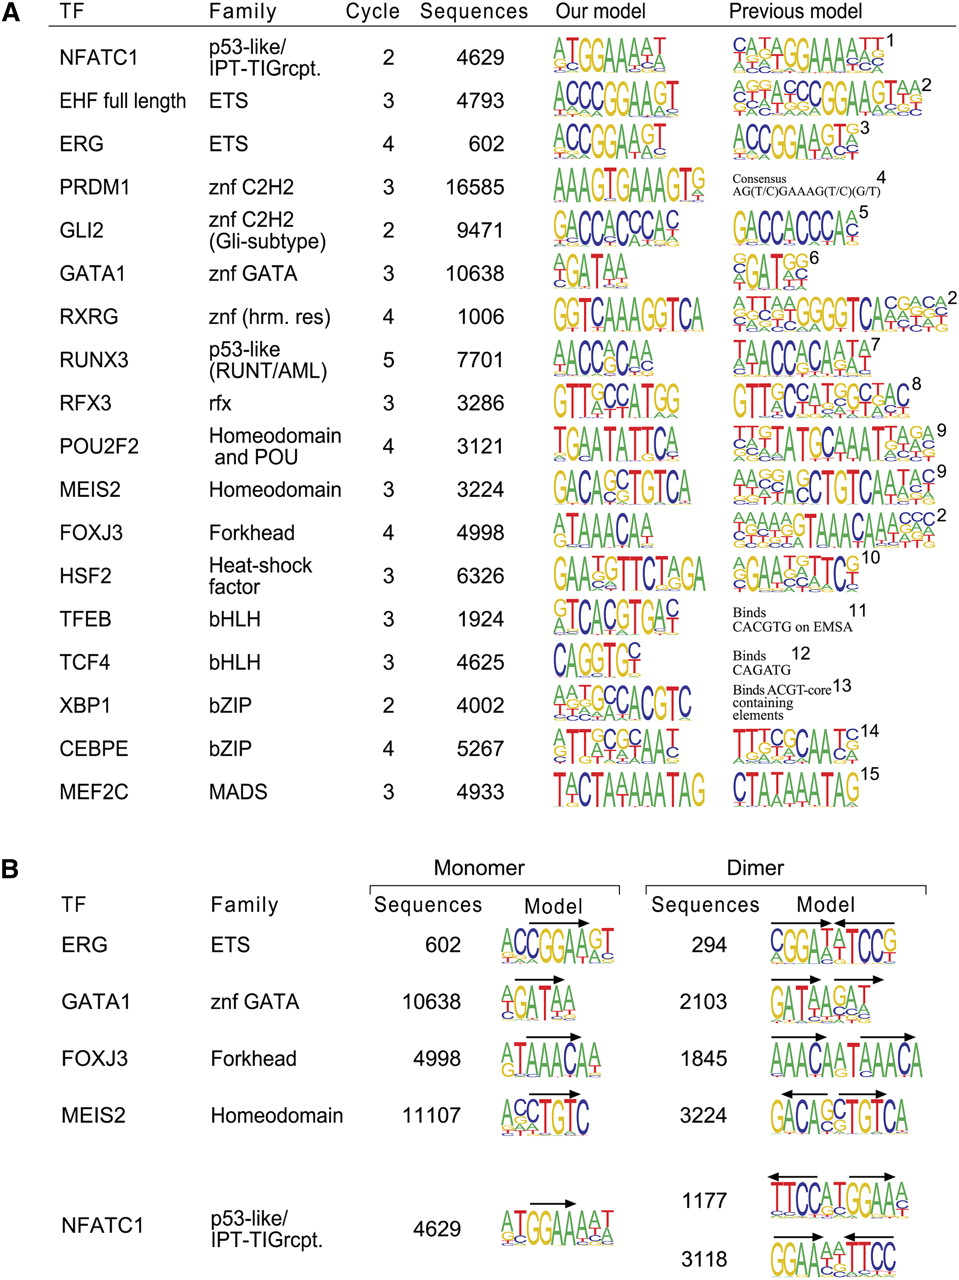
Binding profiles. (A) Comparison of determined binding-specificity models with previously known data. The left columns indicate the transcription factor analyzed and its DNA-binding domain family. The SELEX cycle from where the model is derived and the number of independent sequences included in it are also indicated. The previous model for the same protein or for the closest related ortholog (o) or paralog (p) is shown, including reference. These are RUNX1 for RUNX3, mouse RXRA for RXRG, RFX1 for RFX3, mouse MEIS1 for MEIS2, mouse EHF for EHF, mouse POU2F2 for POU2F2, mouse MEIS1 for MEIS2, CEBPA for CEBPE, and MEF2A for MEF2C. References: (1) Kel et al. (1999); (2) Badis et al. (2009); (3) Wei et al. (2010); (4) Lord et al. (2009); (5) Hallikas et al. (2006); (6) Merika and Orkin (1993); (7) Meyers et al. (1993); (8) Emery et al. (1996); (9) Berger et al. (2008); (10) Kroeger and Morimoto (1994); (11) Fisher et al. (1991); (12) Pscherer et al. (1996); (13) Clauss et al. (1996); (14) Grange et al. (1991); (15) Pollock and Treisman (1991). (B) Monomeric and dimeric binding modes. Factors that can bind DNA either as monomers or as dimers are shown; arrows indicate orientations of the monomeric sites. Two dimeric motifs, dimer1 (top) and dimer2 (bottom), were found for NFATC1; a profile similar to the dimer2 has been previously reported by Falvo et al. (2008) for the paralog NFATC2.


