
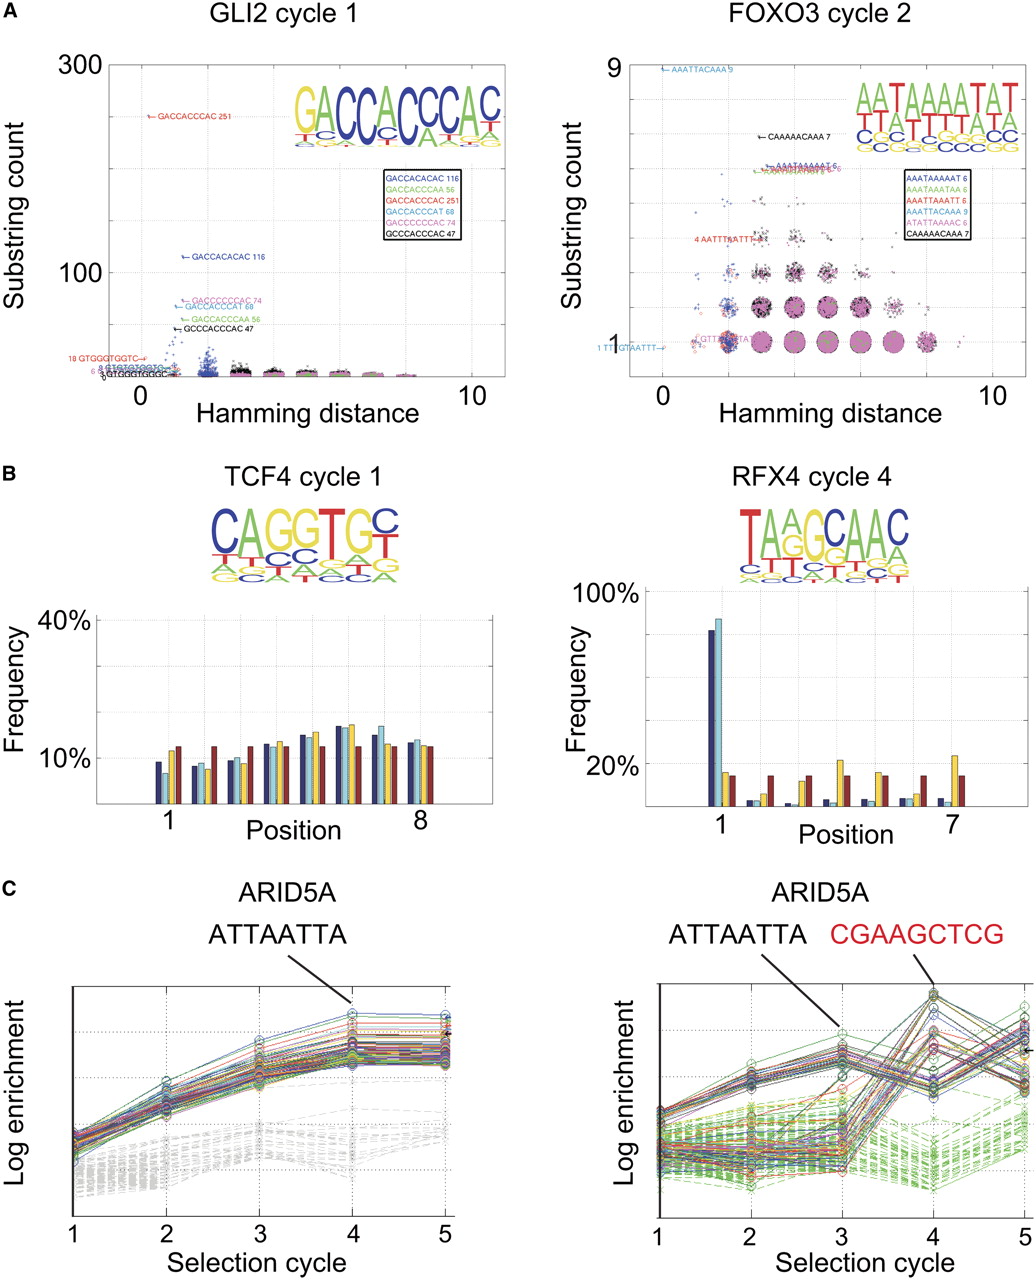
Description of the bioinformatic visualization and quality-control pipeline. (A) Hamming distance plot. Incidences of all possible subsequences of length 10 (substring count) are plotted as a function of their Hamming distance (number of substitutions) from the most enriched sequence or its reverse complement. To facilitate visualization, random floating point values between −0.3 and 0.3 are added to all plotted x and y values. Note that in a successful experiment (left, GLI2), clear enrichment of sequences is observed, and many enriched sequences are found at a short Hamming distance (1 to 2). In a failed experiment (right, FOXO3), enrichment is very weak, and the enriched sequences are not clearly related to each other. (Insets) Position weight matrices from the same experiments. (B) Position plot. (Bottom) Fractional incidence (frequency) of subsequences of indicated length at each position in both strands (blue), the forward (direction indicated in top; light blue), and reverse (yellow) strand of the 14-bp random sequence. Numbers are separately normalized for each set of bars to add up to 100%, and uniform distribution (red) is shown as control. (Left) Note that in cases where flanking sequences do not interfere with binding, a very uniform distribution of sequences is observed. (Right) In cases where a part of the binding sequence for a TF is found in the constant region or barcode, a strong positional bias is observed. (C) Enrichment plot. Enrichment of a sample of the most enriched sequences and random sequences are plotted as a function of the SELEX cycle. (Left) Note that the enriched sequences show exponential enrichment (log scale), whereas the random sequences are not appreciably enriched. (Right) In cases of barcode contamination (see text), different sequences can appear to enrich in different SELEX cycles ([black sequence] correct; [red sequence] contaminating sequence). The data in C are from SELEX analysis using purified ARID5A protein-coated plates (see Methods).


