
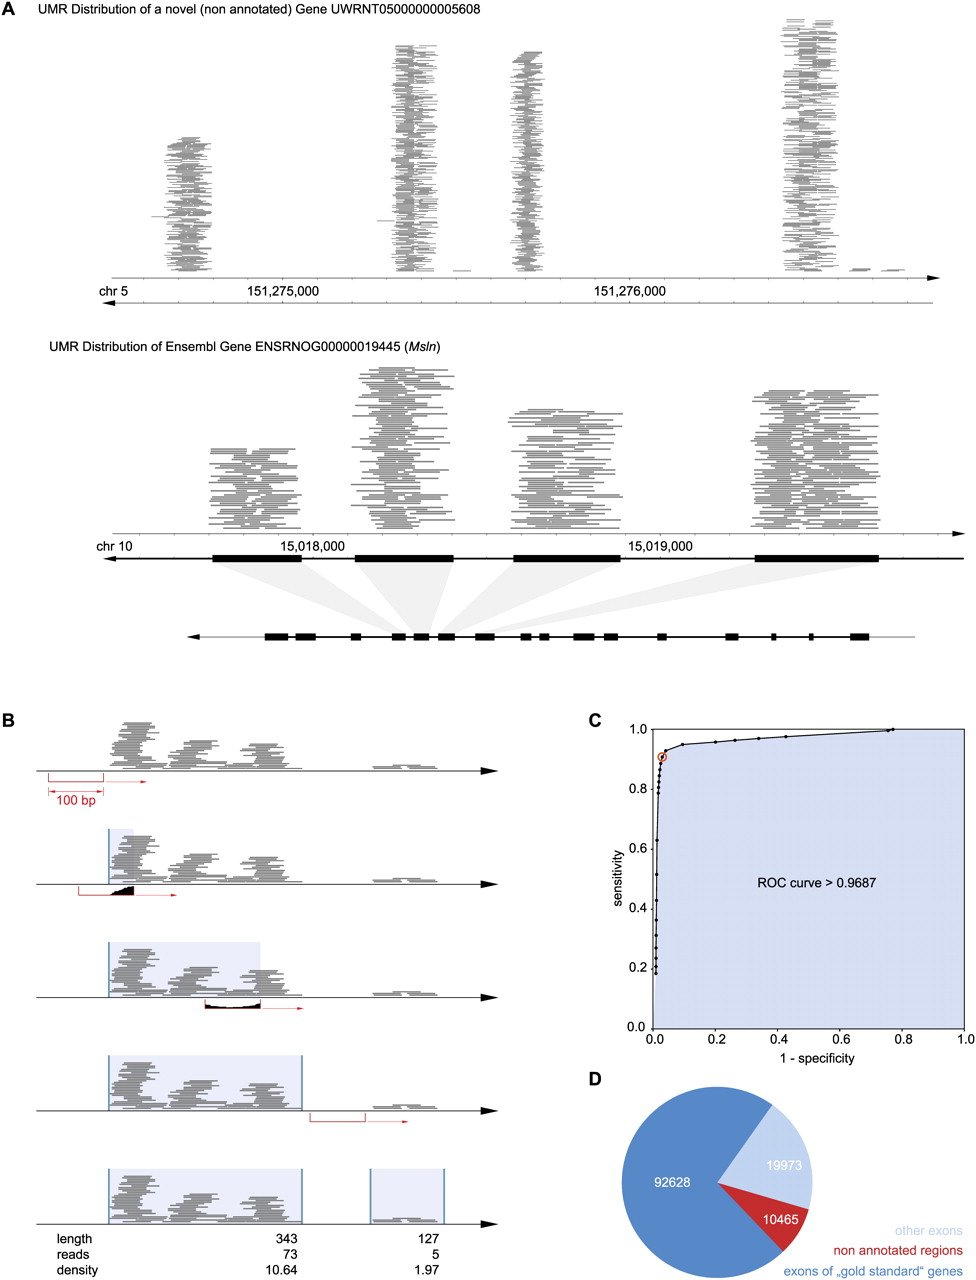
Mapping novel exons in nonannotated regions of the rat genome. (A) Typical UMR distribution. UMR mapped across nonannotated regions of the genome in nonrandom patterns, often resembling exon–intron structure. Depicted are UMR (each gray line = one read) mapped across a nonannotated region of chromosome 5. For comparison, UMR across an annotated region of chromosome 10 are shown along with the annotation of known exons illustrating correspondence. (B) Aggregation of UMR into read “clusters” resembling exons. A 100-bp “sliding window” was moved across the genome demarcating the beginning (UMR present, i.e., “filled” window) and end (UMR absent, i.e., “empty” window) of “UMR clusters.” Resulting UMR clusters differed in read density. Clusters consisting of high piles of hundreds of reads provide strong evidence for an exon, while clusters with few reads appear indeterminate. (C) Classifier for UMR clusters: exon versus no-exon. The newly defined UMR clusters were dichotomized into “exons” and “no exons” using average read density (read coverage) as a classifier. The ROC curve shown here was obtained by applying the classifier to an exploratory subset of 10,367 (annotated) genes, varying read density from 0.25 to 100. Sensitivity and specificity are plotted for 26 different read densities. The classifier was found to be a very precise test with an area under the curve of 0.97. At a read density of 4 (inflection point of the curve indicated as red circle), the sensitivity of the test was 92% and the specificity was 97%. The favorable test characteristics were confirmed in the validation set (sensitivity 91%, specificity of 97%). Applying the procedure to the full data set, 123,066 UMR exon clusters were found. (D) Location of UMR exon clusters. 10,464 new exons were found (i.e., UMR clusters with density >4 in a nonannotated region); the remaining clusters overlapped known exons belonging either to the 10,367 genes quantified above or to other annotated genes.


