
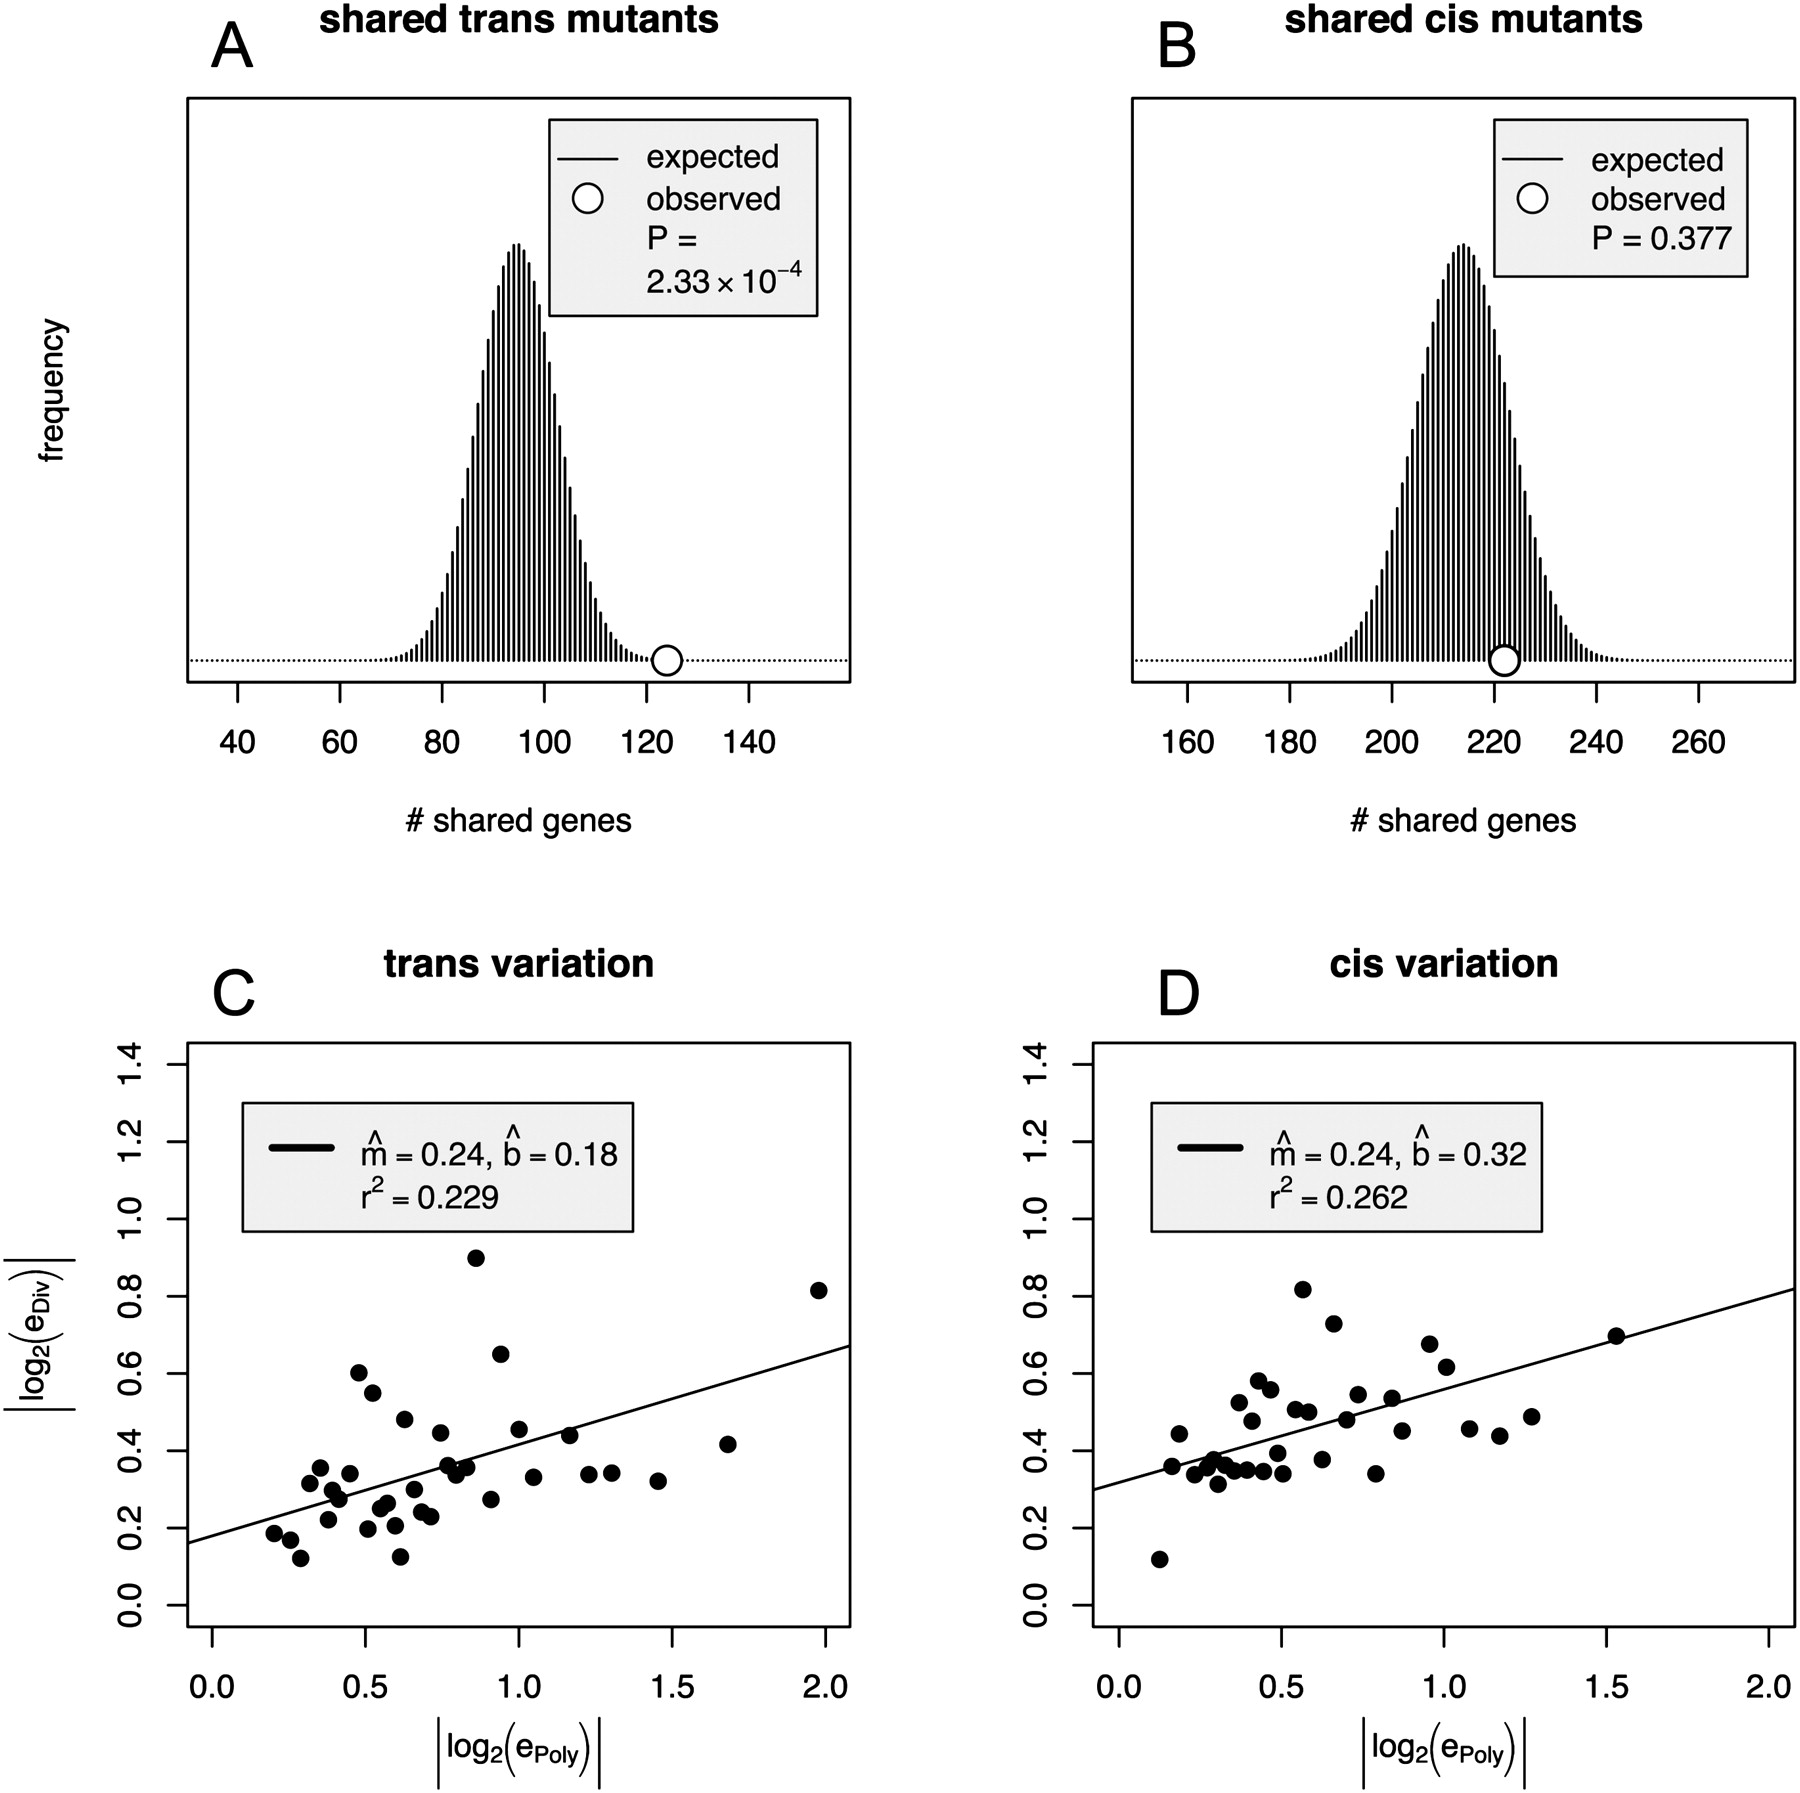
Greater correlation between trans polymorphism and divergence than between cis polymorphism and divergence. (A,B) The number of significant genes manifested both between intraspecific measurements and interspecific measurements for trans (A) and cis (B). The histograms indicate the null hypothesis of homogeneous association between significant polymorphisms and significant divergence. Let P be the number of genes with significant expression differences within species and D be the number of differences between species. If P gene names were randomly drawn without replacement from the gene list, the histogram represents the probability that an independent draw of D genes results in x genes common to both lists. Each histogram is the hypergeometric distribution representing the upper lefthand cell in the 2 × 2 table in a Fisher's exact test (Table 1B). For trans genes (A), the cell indicates overlap between significant expression polymorphisms and significant expression divergence and it is significantly higher than expected by chance, while for the cis genes (B), the overlap is well within the range expected simply by randomly shuffling the data. (C,D) The relationship between polymorphism and divergence estimates is shown for genes with significant polymorphism estimates. The regression estimate between trans polymorphism and divergence describes 23% of the variance, while that between cis polymorphism and divergence describes 26%. Each point is composed of genes grouped by bins according to polymorphism estimates. The values are obtained by taking the median of each bin for divergence and polymorphism. Each bin contains 11 or 12 genes.


