
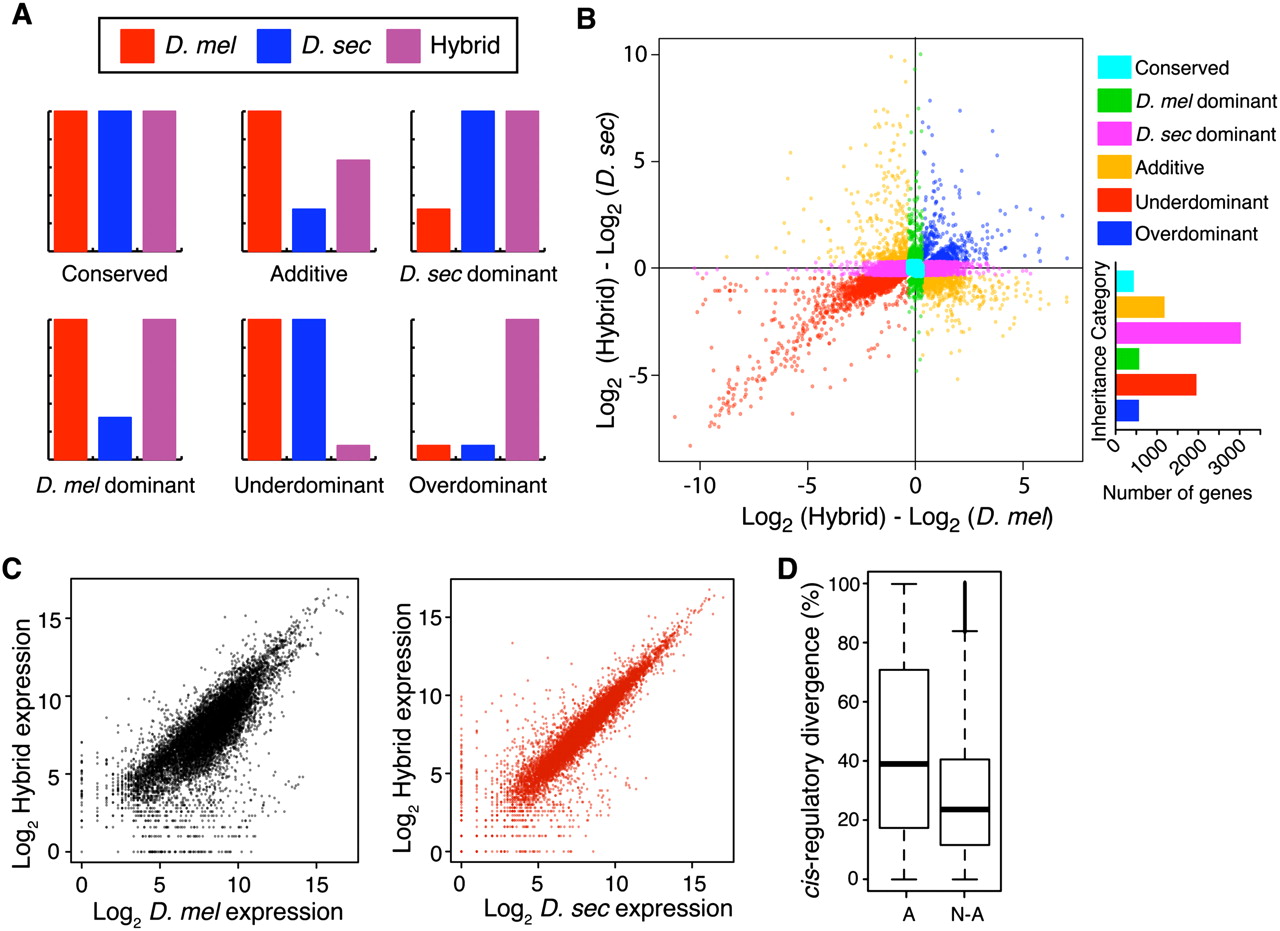
Inheritance of gene expression levels in F1 hybrids between D. melanogaster and D. sechellia. (A) Hypothetical patterns of gene expression in D. melanogaster (red), D. sechellia (blue), and F1 hybrids (purple) illustrating conserved, additive, dominant, under-dominant, and over-dominant modes of inheritance are shown. (B) The scatterplot compares the differences in expression level between the F1 hybrid and each of the parental species (D. melanogaster on x-axis; D. sechellia on y-axis) for each differentially expressed gene. The bar graph (right) shows the frequency of genes in each inheritance category. (C) Plots compare total expression levels (i.e., log2 normalized read-hits) in F1 hybrids to total expression levels in D. melanogaster (black) and D. sechellia (red). Expression of genes with divergent expression between species was more similar in F1 hybrids to D. sechellia (τ = 0.80, P < 2 × 10⁻¹⁶) than D. melanogaster (τ = 0.57, P < 2 × 10⁻¹⁶). This similarity may result from dominance of D. sechellia alleles within homologous cells or a greater morphological similarity of F1 hybrids to D. sechellia than to D. melanogaster. Over half of the genes that showed dominance of the D. sechellia allele (59%, N = 3026; binomial exact test, P < 2 × 10⁻¹⁶) had lower expression in F1 hybrids than in D. melanogaster, while over half of the genes showing dominance of the D. melanogaster expression level had higher expression in F1 hybrids than in D. sechellia (62%, N = 572; binomial exact test, P < 3 × 10⁻⁸). (D) Distributions of percent cis for genes showing additive (A) and nonadditive (N-A) inheritance.


