
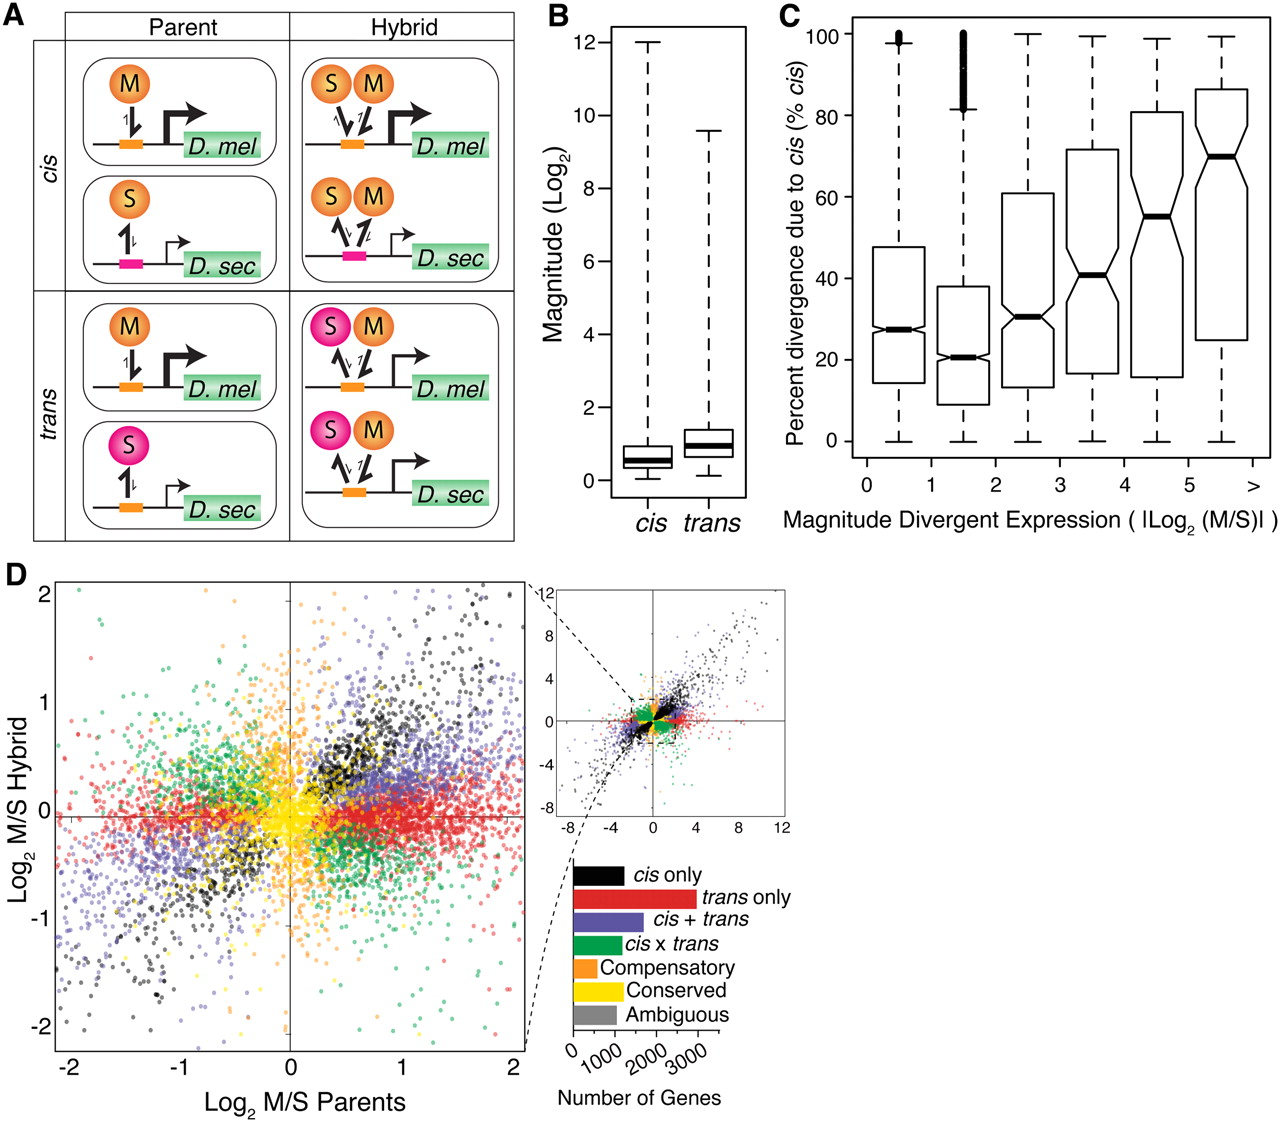
Dissecting cis and trans regulatory differences. (A) Two hypothetical regulatory divergence scenarios are shown. In the top section, a cis-regulatory change in D. sechellia (pink boxes) causes a reduction in affinity for both the conserved D. melanogaster and D. sechellia transcription factors (orange circles). In the bottom section, a trans-regulatory change in a D. sechellia transcription factor (pink circles) reduces its binding affinity for the conserved D. melanogaster and D. sechellia cis-regulatory sequences (orange boxes). The relative expression level is indicated by the promoter arrow thickness. The size of the one-sided arrows show the relative “on” and “off” rates for the transcription factor binding to the cis-regulatory DNA sequence. Note that the cis-regulatory change affects expression of only the D. sechellia allele in F1 hybrids, whereas the trans-regulatory change affects expression of both the D. melanogaster and D. sechellia alleles. (B) Box plots summarize the fold expression differences resulting from cis and trans regulatory divergence. (C) The distribution of percent cis is shown for six groups of genes that differ in the magnitude of total expression divergence between species. Genes were binned based on the absolute value of log2-transformed expression divergence (|log2(M/S)|), and 4086, 2590, 625, 171, 104, and 163 genes were contained within bins 0–1, 1–2, 2–3, 3–4, 4–5, and >5, respectively. Nonoverlapping notches depict statistically significant differences in the median percent cis between pairs of bins. (D) Plot summarizes the relative, allele-specific expression levels in parental and hybrid data sets. Each point represents a single gene and is color-coded according to the mechanism of regulatory evolution inferred from a hierarchical series of statistical tests (FDR = 0.5%; Supplemental Fig. S4). The bar graph depicts the number of genes in each category.


